

(a)
(d)
(g)
4.6. ACCRETIVE GROWTH
(b)
(e)
(h)
135
(c)
(f)
(i)
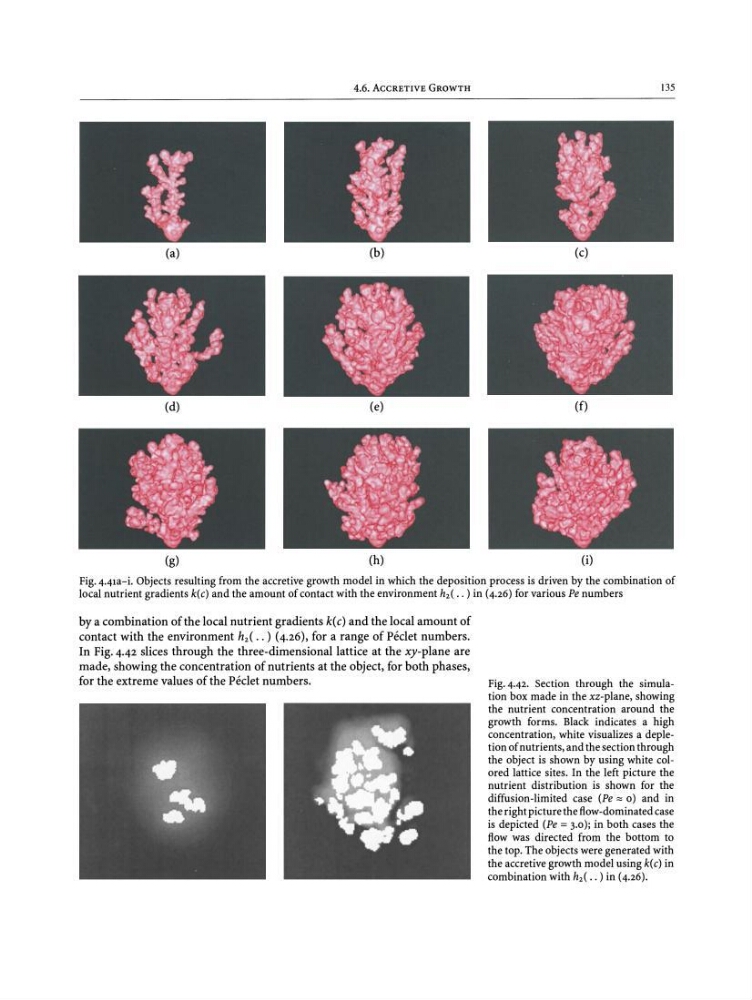
Fig.a.ara-i. Objects resulting from the accretive growth model in which the deposition process is driven by the combination of
local nutrient gradients k(c) and the amount of contact with the environment h 2 ( • • ) in (4.26) for various Pe numbers
by a combination of the local nutrient gradients k(c) and the local amount of
contact with the environment h 2 ( •• ) (4.26), for a range of Peeler numbers.
In Fig. 4.42 slices through the three-dimensional lattice at the xy-plane are
made, showing the concentration of nutrients at the object, for both phases,
for the extreme values of the Peclet numbers.
Fig. 4.42. Section through the simulation box made in the xz-plane, showing
the nutrient concentration around the
growth forms. Black indicates a high
concentration, white visualizes a depletion of nutrients, and the section through
the object is shown by using white colored lattice sites. In the left picture the
nutrient distribution is shown for the
diffusion -limited case (Pe:::: 0) and in
the right picture the flow-dominated case
is depicted (Pe = 3.0); in both cases the
flow was directed from the bottom to
the top. The objects were generated with
the accretive growth model using k(c) in
combination with h 2 ( • • ) in (4 .26) .
(d)
(g)
4.6. ACCRETIVE GROWTH
(b)
(e)
(h)
135
(c)
(f)
(i)
Fig.a.ara-i. Objects resulting from the accretive growth model in which the deposition process is driven by the combination of
local nutrient gradients k(c) and the amount of contact with the environment h 2 ( • • ) in (4.26) for various Pe numbers
by a combination of the local nutrient gradients k(c) and the local amount of
contact with the environment h 2 ( •• ) (4.26), for a range of Peeler numbers.
In Fig. 4.42 slices through the three-dimensional lattice at the xy-plane are
made, showing the concentration of nutrients at the object, for both phases,
for the extreme values of the Peclet numbers.
Fig. 4.42. Section through the simulation box made in the xz-plane, showing
the nutrient concentration around the
growth forms. Black indicates a high
concentration, white visualizes a depletion of nutrients, and the section through
the object is shown by using white colored lattice sites. In the left picture the
nutrient distribution is shown for the
diffusion -limited case (Pe:::: 0) and in
the right picture the flow-dominated case
is depicted (Pe = 3.0); in both cases the
flow was directed from the bottom to
the top. The objects were generated with
the accretive growth model using k(c) in
combination with h 2 ( • • ) in (4 .26) .