

14 Underwater Multimodal Survey: Merging Optical and Acoustic Data
235
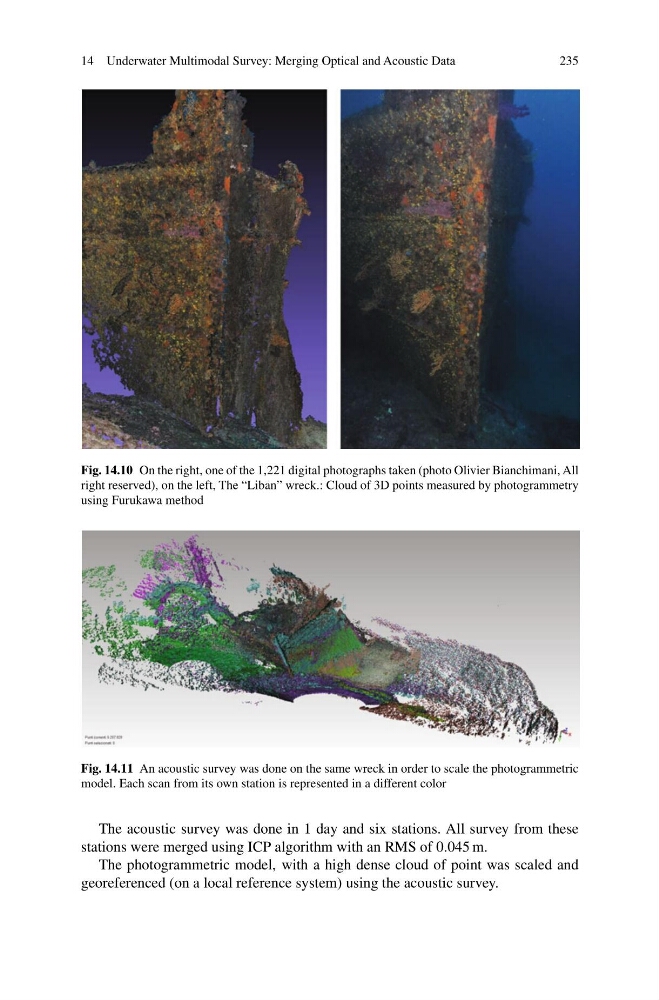
Fig. 14.10 On the right, one of the 1,221 digital photographs taken (photo Olivier Bianchimani, All
right reserved), on the left, The “Liban” wreck.: Cloud of 3D points measured by photogrammetry
using Furukawa method
Fig. 14.11 An acoustic survey was done on the same wreck in order to scale the photogrammetric
model. Each scan from its own station is represented in a different color
The acoustic survey was done in 1 day and six stations. All survey from these
stations were merged using ICP algorithm with an RMS of 0.045 m.
The photogrammetric model, with a high dense cloud of point was scaled and
georeferenced (on a local reference system) using the acoustic survey.
235
Fig. 14.10 On the right, one of the 1,221 digital photographs taken (photo Olivier Bianchimani, All
right reserved), on the left, The “Liban” wreck.: Cloud of 3D points measured by photogrammetry
using Furukawa method
Fig. 14.11 An acoustic survey was done on the same wreck in order to scale the photogrammetric
model. Each scan from its own station is represented in a different color
The acoustic survey was done in 1 day and six stations. All survey from these
stations were merged using ICP algorithm with an RMS of 0.045 m.
The photogrammetric model, with a high dense cloud of point was scaled and
georeferenced (on a local reference system) using the acoustic survey.