

510
Bronwyn M. Gillanders
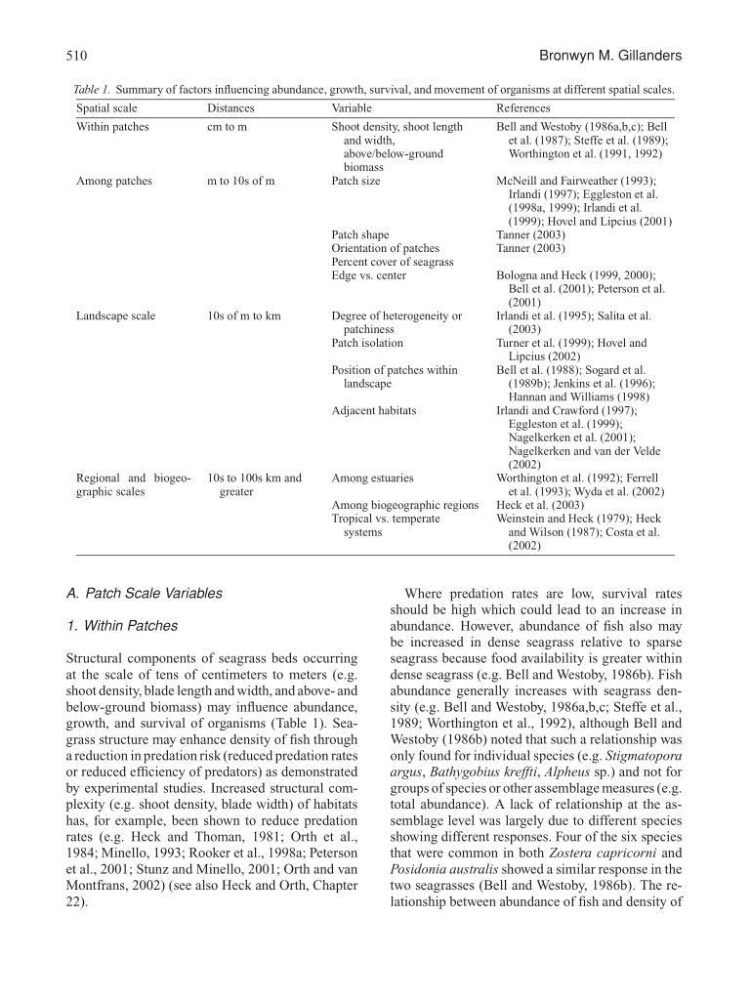
Table 1. Summary of factors influencing abundance, growth, survival, and movement of organisms at different spatial scales.
Spatial scale
Distances
Variable
References
Within patches
cm to m
Shoot density, shoot length
and width,
above/below-ground
biomass
Bell and Westoby (1986a,b,c); Bell
et al. (1987); Steffe et al. (1989);
Worthington et al. (1991, 1992)
Among patches
m to 10s of m
Patch size
McNeill and Fairweather (1993);
Irlandi (1997); Eggleston et al.
(1998a, 1999); Irlandi et al.
(1999); Hovel and Lipcius (2001)
Patch shape
Tanner (2003)
Orientation of patches
Tanner (2003)
Percent cover of seagrass
Edge vs. center
Bologna and Heck (1999, 2000);
Bell et al. (2001); Peterson et al.
(2001)
Landscape scale
10s of m to km
Degree of heterogeneity or
patchiness
Irlandi et al. (1995); Salita et al.
(2003)
Patch isolation
Turner et al. (1999); Hovel and
Lipcius (2002)
Position of patches within
landscape
Bell et al. (1988); Sogard et al.
(1989b); Jenkins et al. (1996);
Hannan and Williams (1998)
Adjacent habitats
Irlandi and Crawford (1997);
Eggleston et al. (1999);
Nagelkerken et al. (2001);
Nagelkerken and van der Velde
(2002)
Regional and biogeographic scales
10s to 100s km and
greater
Among estuaries
Worthington et al. (1992); Ferrell
et al. (1993); Wyda et al. (2002)
Among biogeographic regions Heck et al. (2003)
Tropical vs. temperate
systems
Weinstein and Heck (1979); Heck
and Wilson (1987); Costa et al.
(2002)
A. Patch Scale Variables
1. Within Patches
Structural components of seagrass beds occurring
at the scale of tens of centimeters to meters (e.g.
shoot density, blade length and width, and above- and
below-ground biomass) may influence abundance,
growth, and survival of organisms (Table 1). Seagrass structure may enhance density of fish through
a reduction in predation risk (reduced predation rates
or reduced efficiency of predators) as demonstrated
by experimental studies. Increased structural complexity (e.g. shoot density, blade width) of habitats
has, for example, been shown to reduce predation
rates (e.g. Heck and Thoman, 1981; Orth et al.,
1984; Minello, 1993; Rooker et al., 1998a; Peterson
et al., 2001; Stunz and Minello, 2001; Orth and van
Montfrans, 2002) (see also Heck and Orth, Chapter
22).
Where predation rates are low, survival rates
should be high which could lead to an increase in
abundance. However, abundance of fish also may
be increased in dense seagrass relative to sparse
seagrass because food availability is greater within
dense seagrass (e.g. Bell and Westoby, 1986b). Fish
abundance generally increases with seagrass density (e.g. Bell and Westoby, 1986a,b,c; Steffe et al.,
1989; Worthington et al., 1992), although Bell and
Westoby (1986b) noted that such a relationship was
only found for individual species (e.g. Stigmatopora
argus, Bathygobius kreffti, Alpheus sp.) and not for
groups of species or other assemblage measures (e.g.
total abundance). A lack of relationship at the assemblage level was largely due to different species
showing different responses. Four of the six species
that were common in both Zostera capricorni and
Posidonia australis showed a similar response in the
two seagrasses (Bell and Westoby, 1986b). The relationship between abundance of fish and density of
Bronwyn M. Gillanders
Table 1. Summary of factors influencing abundance, growth, survival, and movement of organisms at different spatial scales.
Spatial scale
Distances
Variable
References
Within patches
cm to m
Shoot density, shoot length
and width,
above/below-ground
biomass
Bell and Westoby (1986a,b,c); Bell
et al. (1987); Steffe et al. (1989);
Worthington et al. (1991, 1992)
Among patches
m to 10s of m
Patch size
McNeill and Fairweather (1993);
Irlandi (1997); Eggleston et al.
(1998a, 1999); Irlandi et al.
(1999); Hovel and Lipcius (2001)
Patch shape
Tanner (2003)
Orientation of patches
Tanner (2003)
Percent cover of seagrass
Edge vs. center
Bologna and Heck (1999, 2000);
Bell et al. (2001); Peterson et al.
(2001)
Landscape scale
10s of m to km
Degree of heterogeneity or
patchiness
Irlandi et al. (1995); Salita et al.
(2003)
Patch isolation
Turner et al. (1999); Hovel and
Lipcius (2002)
Position of patches within
landscape
Bell et al. (1988); Sogard et al.
(1989b); Jenkins et al. (1996);
Hannan and Williams (1998)
Adjacent habitats
Irlandi and Crawford (1997);
Eggleston et al. (1999);
Nagelkerken et al. (2001);
Nagelkerken and van der Velde
(2002)
Regional and biogeographic scales
10s to 100s km and
greater
Among estuaries
Worthington et al. (1992); Ferrell
et al. (1993); Wyda et al. (2002)
Among biogeographic regions Heck et al. (2003)
Tropical vs. temperate
systems
Weinstein and Heck (1979); Heck
and Wilson (1987); Costa et al.
(2002)
A. Patch Scale Variables
1. Within Patches
Structural components of seagrass beds occurring
at the scale of tens of centimeters to meters (e.g.
shoot density, blade length and width, and above- and
below-ground biomass) may influence abundance,
growth, and survival of organisms (Table 1). Seagrass structure may enhance density of fish through
a reduction in predation risk (reduced predation rates
or reduced efficiency of predators) as demonstrated
by experimental studies. Increased structural complexity (e.g. shoot density, blade width) of habitats
has, for example, been shown to reduce predation
rates (e.g. Heck and Thoman, 1981; Orth et al.,
1984; Minello, 1993; Rooker et al., 1998a; Peterson
et al., 2001; Stunz and Minello, 2001; Orth and van
Montfrans, 2002) (see also Heck and Orth, Chapter
22).
Where predation rates are low, survival rates
should be high which could lead to an increase in
abundance. However, abundance of fish also may
be increased in dense seagrass relative to sparse
seagrass because food availability is greater within
dense seagrass (e.g. Bell and Westoby, 1986b). Fish
abundance generally increases with seagrass density (e.g. Bell and Westoby, 1986a,b,c; Steffe et al.,
1989; Worthington et al., 1992), although Bell and
Westoby (1986b) noted that such a relationship was
only found for individual species (e.g. Stigmatopora
argus, Bathygobius kreffti, Alpheus sp.) and not for
groups of species or other assemblage measures (e.g.
total abundance). A lack of relationship at the assemblage level was largely due to different species
showing different responses. Four of the six species
that were common in both Zostera capricorni and
Posidonia australis showed a similar response in the
two seagrasses (Bell and Westoby, 1986b). The relationship between abundance of fish and density of