

442
Michael A. Borowitzka, Paul Lavery, and Mike van Keulen
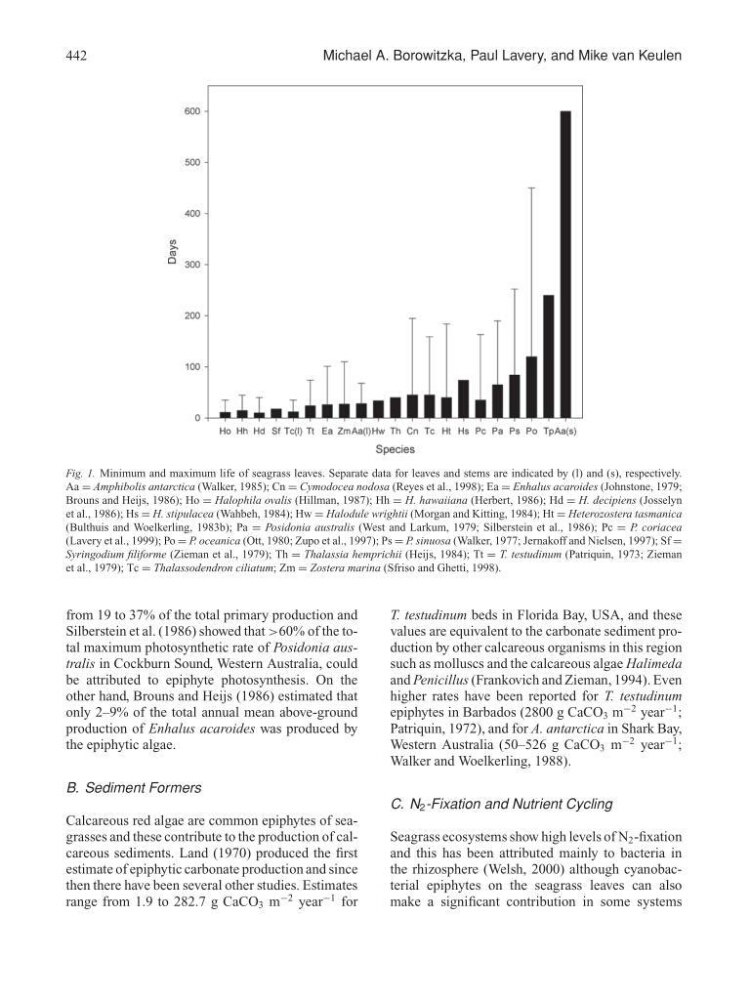
Fig. 1. Minimum and maximum life of seagrass leaves. Separate data for leaves and stems are indicated by (l) and (s), respectively.
Aa = Amphibolis antarctica (Walker, 1985); Cn = Cymodocea nodosa (Reyes et al., 1998); Ea = Enhalus acaroides (Johnstone, 1979;
Brouns and Heijs, 1986); Ho = Halophila ovalis (Hillman, 1987); Hh = H. hawaiiana (Herbert, 1986); Hd = H. decipiens (Josselyn
et al., 1986); Hs = H. stipulacea (Wahbeh, 1984); Hw = Halodule wrightii (Morgan and Kitting, 1984); Ht = Heterozostera tasmanica
(Bulthuis and Woelkerling, 1983b); Pa = Posidonia australis (West and Larkum, 1979; Silberstein et al., 1986); Pc = P. coriacea
(Lavery et al., 1999); Po = P. oceanica (Ott, 1980; Zupo et al., 1997); Ps = P. sinuosa (Walker, 1977; Jernakoff and Nielsen, 1997); Sf =
Syringodium filiforme (Zieman et al., 1979); Th = Thalassia hemprichii (Heijs, 1984); Tt = T. testudinum (Patriquin, 1973; Zieman
et al., 1979); Tc = Thalassodendron ciliatum; Zm = Zostera marina (Sfriso and Ghetti, 1998).
from 19 to 37% of the total primary production and
Silberstein et al. (1986) showed that >60% of the total maximum photosynthetic rate of Posidonia australis in Cockburn Sound, Western Australia, could
be attributed to epiphyte photosynthesis. On the
other hand, Brouns and Heijs (1986) estimated that
only 2–9% of the total annual mean above-ground
production of Enhalus acaroides was produced by
the epiphytic algae.
B. Sediment Formers
Calcareous red algae are common epiphytes of seagrasses and these contribute to the production of calcareous sediments. Land (1970) produced the first
estimate of epiphytic carbonate production and since
then there have been several other studies. Estimates
range from 1.9 to 282.7 g CaCO 3 m
−2 year
−1 for
T. testudinum beds in Florida Bay, USA, and these
values are equivalent to the carbonate sediment production by other calcareous organisms in this region
such as molluscs and the calcareous algae Halimeda
and Penicillus (Frankovich and Zieman, 1994). Even
higher rates have been reported for T. testudinum
epiphytes in Barbados (2800 g CaCO 3 m
−2 year
−1 ;
Patriquin, 1972), and for A. antarctica in Shark Bay,
Western Australia (50–526 g CaCO 3 m
−2 year
−1 ;
Walker and Woelkerling, 1988).
C. N 2 -Fixation and Nutrient Cycling
Seagrass ecosystems show high levels of N 2 -fixation
and this has been attributed mainly to bacteria in
the rhizosphere (Welsh, 2000) although cyanobacterial epiphytes on the seagrass leaves can also
make a significant contribution in some systems
Michael A. Borowitzka, Paul Lavery, and Mike van Keulen
Fig. 1. Minimum and maximum life of seagrass leaves. Separate data for leaves and stems are indicated by (l) and (s), respectively.
Aa = Amphibolis antarctica (Walker, 1985); Cn = Cymodocea nodosa (Reyes et al., 1998); Ea = Enhalus acaroides (Johnstone, 1979;
Brouns and Heijs, 1986); Ho = Halophila ovalis (Hillman, 1987); Hh = H. hawaiiana (Herbert, 1986); Hd = H. decipiens (Josselyn
et al., 1986); Hs = H. stipulacea (Wahbeh, 1984); Hw = Halodule wrightii (Morgan and Kitting, 1984); Ht = Heterozostera tasmanica
(Bulthuis and Woelkerling, 1983b); Pa = Posidonia australis (West and Larkum, 1979; Silberstein et al., 1986); Pc = P. coriacea
(Lavery et al., 1999); Po = P. oceanica (Ott, 1980; Zupo et al., 1997); Ps = P. sinuosa (Walker, 1977; Jernakoff and Nielsen, 1997); Sf =
Syringodium filiforme (Zieman et al., 1979); Th = Thalassia hemprichii (Heijs, 1984); Tt = T. testudinum (Patriquin, 1973; Zieman
et al., 1979); Tc = Thalassodendron ciliatum; Zm = Zostera marina (Sfriso and Ghetti, 1998).
from 19 to 37% of the total primary production and
Silberstein et al. (1986) showed that >60% of the total maximum photosynthetic rate of Posidonia australis in Cockburn Sound, Western Australia, could
be attributed to epiphyte photosynthesis. On the
other hand, Brouns and Heijs (1986) estimated that
only 2–9% of the total annual mean above-ground
production of Enhalus acaroides was produced by
the epiphytic algae.
B. Sediment Formers
Calcareous red algae are common epiphytes of seagrasses and these contribute to the production of calcareous sediments. Land (1970) produced the first
estimate of epiphytic carbonate production and since
then there have been several other studies. Estimates
range from 1.9 to 282.7 g CaCO 3 m
−2 year
−1 for
T. testudinum beds in Florida Bay, USA, and these
values are equivalent to the carbonate sediment production by other calcareous organisms in this region
such as molluscs and the calcareous algae Halimeda
and Penicillus (Frankovich and Zieman, 1994). Even
higher rates have been reported for T. testudinum
epiphytes in Barbados (2800 g CaCO 3 m
−2 year
−1 ;
Patriquin, 1972), and for A. antarctica in Shark Bay,
Western Australia (50–526 g CaCO 3 m
−2 year
−1 ;
Walker and Woelkerling, 1988).
C. N 2 -Fixation and Nutrient Cycling
Seagrass ecosystems show high levels of N 2 -fixation
and this has been attributed mainly to bacteria in
the rhizosphere (Welsh, 2000) although cyanobacterial epiphytes on the seagrass leaves can also
make a significant contribution in some systems