

420
B. I. van Tussenbroek, J. A. Vonk, J. Stapel et al.
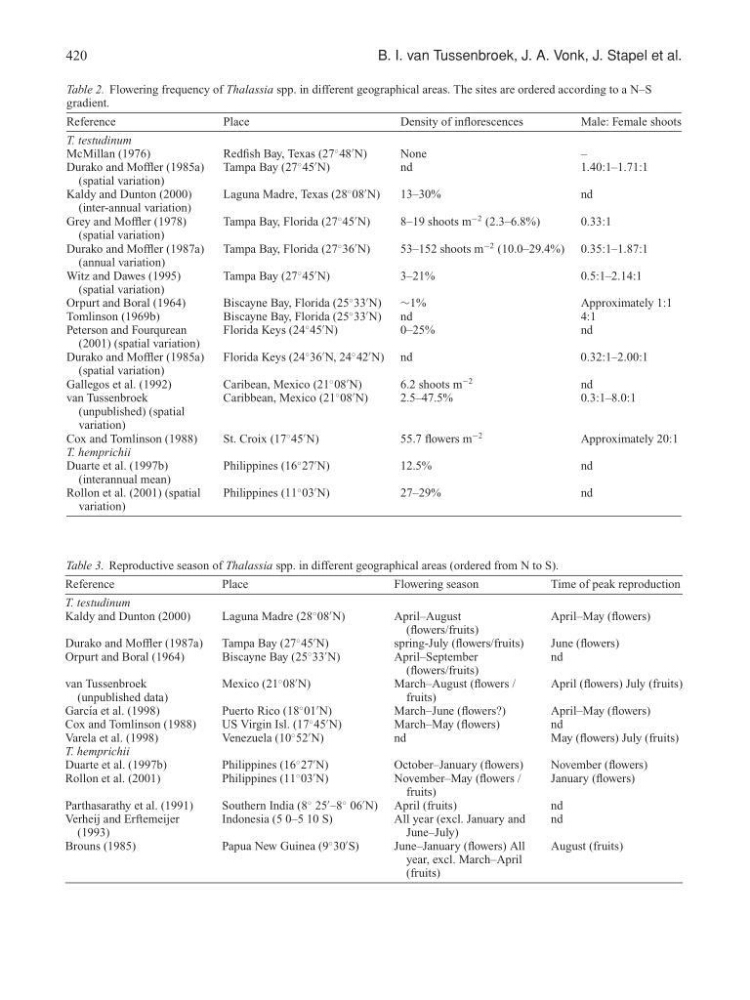
Table 2. Flowering frequency of Thalassia spp. in different geographical areas. The sites are ordered according to a N–S
gradient.
Reference
Place
Density of inflorescences
Male: Female shoots
T. testudinum
McMillan (1976)
Redfish Bay, Texas (27
◦ 48
N)
None
–
Durako and Moffler (1985a)
(spatial variation)
Tampa Bay (27
◦ 45
N)
nd
1.40:1–1.71:1
Kaldy and Dunton (2000)
(inter-annual variation)
Laguna Madre, Texas (28
◦ 08
N)
13–30%
nd
Grey and Moffler (1978)
(spatial variation)
Tampa Bay, Florida (27
◦ 45
N)
8–19 shoots m
−2 (2.3–6.8%)
0.33:1
Durako and Moffler (1987a)
(annual variation)
Tampa Bay, Florida (27
◦ 36
N)
53–152 shoots m
−2 (10.0–29.4%) 0.35:1–1.87:1
Witz and Dawes (1995)
(spatial variation)
Tampa Bay (27
◦ 45
N)
3–21%
0.5:1–2.14:1
Orpurt and Boral (1964)
Biscayne Bay, Florida (25
◦ 33
N)
∼1%
Approximately 1:1
Tomlinson (1969b)
Biscayne Bay, Florida (25
◦ 33
N)
nd
4:1
Peterson and Fourqurean
(2001) (spatial variation)
Florida Keys (24
◦ 45
N)
0–25%
nd
Durako and Moffler (1985a)
(spatial variation)
Florida Keys (24
◦ 36
N, 24
◦ 42
N) nd
0.32:1–2.00:1
Gallegos et al. (1992)
Caribean, Mexico (21
◦ 08
N)
6.2 shoots m
−2
nd
van Tussenbroek
(unpublished) (spatial
variation)
Caribbean, Mexico (21
◦ 08
N)
2.5–47.5%
0.3:1–8.0:1
Cox and Tomlinson (1988)
St. Croix (17
◦ 45
N)
55.7 flowers m
−2
Approximately 20:1
T. hemprichii
Duarte et al. (1997b)
(interannual mean)
Philippines (16
◦ 27
N)
12.5%
nd
Rollon et al. (2001) (spatial
variation)
Philippines (11
◦ 03
N)
27–29%
nd
Table 3. Reproductive season of Thalassia spp. in different geographical areas (ordered from N to S).
Reference
Place
Flowering season
Time of peak reproduction
T. testudinum
Kaldy and Dunton (2000)
Laguna Madre (28
◦ 08
N)
April–August
(flowers/fruits)
April–May (flowers)
Durako and Moffler (1987a)
Tampa Bay (27
◦ 45
N)
spring-July (flowers/fruits)
June (flowers)
Orpurt and Boral (1964)
Biscayne Bay (25
◦ 33
N)
April–September
(flowers/fruits)
nd
van Tussenbroek
(unpublished data)
Mexico (21
◦ 08
N)
March–August (flowers /
fruits)
April (flowers) July (fruits)
Garc´ ıa et al. (1998)
Puerto Rico (18
◦ 01
N)
March–June (flowers?)
April–May (flowers)
Cox and Tomlinson (1988)
US Virgin Isl. (17
◦ 45
N)
March–May (flowers)
nd
Varela et al. (1998)
Venezuela (10
◦ 52
N)
nd
May (flowers) July (fruits)
T. hemprichii
Duarte et al. (1997b)
Philippines (16
◦ 27
N)
October–January (flowers)
November (flowers)
Rollon et al. (2001)
Philippines (11
◦ 03
N)
November–May (flowers /
fruits)
January (flowers)
Parthasarathy et al. (1991)
Southern India (8
◦ 25
–8
◦ 06
N) April (fruits)
nd
Verheij and Erftemeijer
(1993)
Indonesia (5 0–5 10 S)
All year (excl. January and
June–July)
nd
Brouns (1985)
Papua New Guinea (9
◦ 30
S)
June–January (flowers) All
year, excl. March–April
(fruits)
August (fruits)
B. I. van Tussenbroek, J. A. Vonk, J. Stapel et al.
Table 2. Flowering frequency of Thalassia spp. in different geographical areas. The sites are ordered according to a N–S
gradient.
Reference
Place
Density of inflorescences
Male: Female shoots
T. testudinum
McMillan (1976)
Redfish Bay, Texas (27
◦ 48
N)
None
–
Durako and Moffler (1985a)
(spatial variation)
Tampa Bay (27
◦ 45
N)
nd
1.40:1–1.71:1
Kaldy and Dunton (2000)
(inter-annual variation)
Laguna Madre, Texas (28
◦ 08
N)
13–30%
nd
Grey and Moffler (1978)
(spatial variation)
Tampa Bay, Florida (27
◦ 45
N)
8–19 shoots m
−2 (2.3–6.8%)
0.33:1
Durako and Moffler (1987a)
(annual variation)
Tampa Bay, Florida (27
◦ 36
N)
53–152 shoots m
−2 (10.0–29.4%) 0.35:1–1.87:1
Witz and Dawes (1995)
(spatial variation)
Tampa Bay (27
◦ 45
N)
3–21%
0.5:1–2.14:1
Orpurt and Boral (1964)
Biscayne Bay, Florida (25
◦ 33
N)
∼1%
Approximately 1:1
Tomlinson (1969b)
Biscayne Bay, Florida (25
◦ 33
N)
nd
4:1
Peterson and Fourqurean
(2001) (spatial variation)
Florida Keys (24
◦ 45
N)
0–25%
nd
Durako and Moffler (1985a)
(spatial variation)
Florida Keys (24
◦ 36
N, 24
◦ 42
N) nd
0.32:1–2.00:1
Gallegos et al. (1992)
Caribean, Mexico (21
◦ 08
N)
6.2 shoots m
−2
nd
van Tussenbroek
(unpublished) (spatial
variation)
Caribbean, Mexico (21
◦ 08
N)
2.5–47.5%
0.3:1–8.0:1
Cox and Tomlinson (1988)
St. Croix (17
◦ 45
N)
55.7 flowers m
−2
Approximately 20:1
T. hemprichii
Duarte et al. (1997b)
(interannual mean)
Philippines (16
◦ 27
N)
12.5%
nd
Rollon et al. (2001) (spatial
variation)
Philippines (11
◦ 03
N)
27–29%
nd
Table 3. Reproductive season of Thalassia spp. in different geographical areas (ordered from N to S).
Reference
Place
Flowering season
Time of peak reproduction
T. testudinum
Kaldy and Dunton (2000)
Laguna Madre (28
◦ 08
N)
April–August
(flowers/fruits)
April–May (flowers)
Durako and Moffler (1987a)
Tampa Bay (27
◦ 45
N)
spring-July (flowers/fruits)
June (flowers)
Orpurt and Boral (1964)
Biscayne Bay (25
◦ 33
N)
April–September
(flowers/fruits)
nd
van Tussenbroek
(unpublished data)
Mexico (21
◦ 08
N)
March–August (flowers /
fruits)
April (flowers) July (fruits)
Garc´ ıa et al. (1998)
Puerto Rico (18
◦ 01
N)
March–June (flowers?)
April–May (flowers)
Cox and Tomlinson (1988)
US Virgin Isl. (17
◦ 45
N)
March–May (flowers)
nd
Varela et al. (1998)
Venezuela (10
◦ 52
N)
nd
May (flowers) July (fruits)
T. hemprichii
Duarte et al. (1997b)
Philippines (16
◦ 27
N)
October–January (flowers)
November (flowers)
Rollon et al. (2001)
Philippines (11
◦ 03
N)
November–May (flowers /
fruits)
January (flowers)
Parthasarathy et al. (1991)
Southern India (8
◦ 25
–8
◦ 06
N) April (fruits)
nd
Verheij and Erftemeijer
(1993)
Indonesia (5 0–5 10 S)
All year (excl. January and
June–July)
nd
Brouns (1985)
Papua New Guinea (9
◦ 30
S)
June–January (flowers) All
year, excl. March–April
(fruits)
August (fruits)