

230
J. Romero, K.-S. Lee, M. P ´
erez, M. A. Mateo, and T. Alcoverro
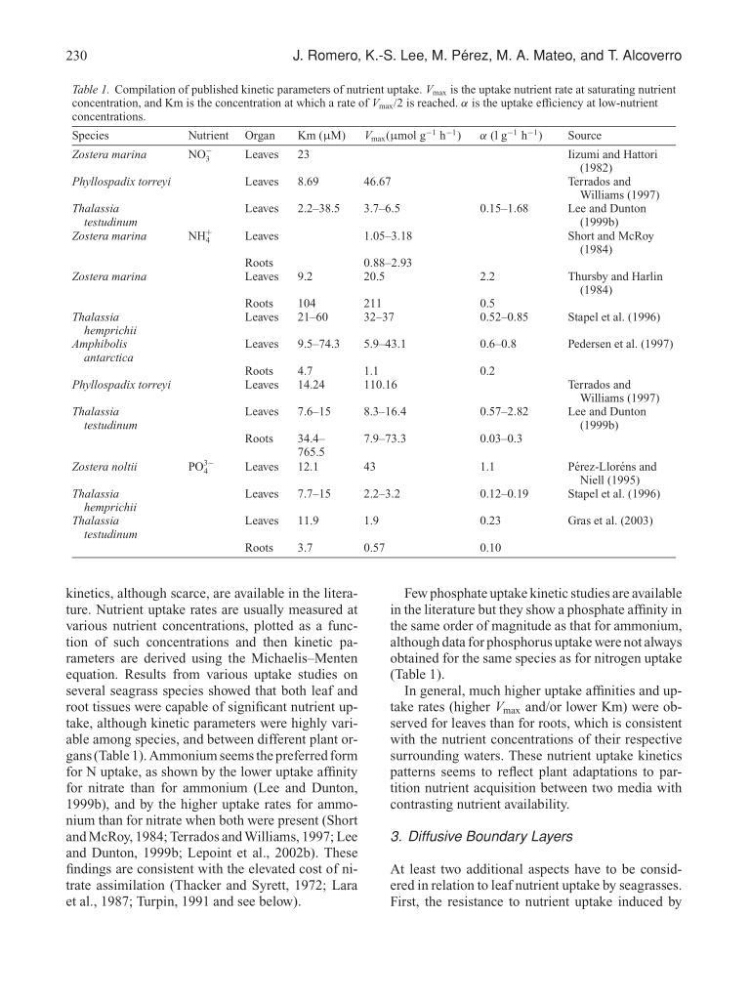
Table 1. Compilation of published kinetic parameters of nutrient uptake. V max is the uptake nutrient rate at saturating nutrient
concentration, and Km is the concentration at which a rate of V max /2 is reached. α is the uptake efficiency at low-nutrient
concentrations.
Species
Nutrient Organ
Km (µM)
V max (µmol g
−1 h
−1 )
α (l g
−1 h
−1 )
Source
Zostera marina
NO
−
3
Leaves
23
Iizumi and Hattori
(1982)
Phyllospadix torreyi
Leaves
8.69
46.67
Terrados and
Williams (1997)
Thalassia
testudinum
Leaves
2.2–38.5
3.7–6.5
0.15–1.68
Lee and Dunton
(1999b)
Zostera marina
NH
+
4
Leaves
1.05–3.18
Short and McRoy
(1984)
Roots
0.88–2.93
Zostera marina
Leaves
9.2
20.5
2.2
Thursby and Harlin
(1984)
Roots
104
211
0.5
Thalassia
hemprichii
Leaves
21–60
32–37
0.52–0.85
Stapel et al. (1996)
Amphibolis
antarctica
Leaves
9.5–74.3
5.9–43.1
0.6–0.8
Pedersen et al. (1997)
Roots
4.7
1.1
0.2
Phyllospadix torreyi
Leaves
14.24
110.16
Terrados and
Williams (1997)
Thalassia
testudinum
Leaves
7.6–15
8.3–16.4
0.57–2.82
Lee and Dunton
(1999b)
Roots
34.4–
765.5
7.9–73.3
0.03–0.3
Zostera noltii
PO
3−
4
Leaves
12.1
43
1.1
P´ erez-Llor´ ens and
Niell (1995)
Thalassia
hemprichii
Leaves
7.7–15
2.2–3.2
0.12–0.19
Stapel et al. (1996)
Thalassia
testudinum
Leaves
11.9
1.9
0.23
Gras et al. (2003)
Roots
3.7
0.57
0.10
kinetics, although scarce, are available in the literature. Nutrient uptake rates are usually measured at
various nutrient concentrations, plotted as a function of such concentrations and then kinetic parameters are derived using the Michaelis–Menten
equation. Results from various uptake studies on
several seagrass species showed that both leaf and
root tissues were capable of significant nutrient uptake, although kinetic parameters were highly variable among species, and between different plant organs (Table 1). Ammonium seems the preferred form
for N uptake, as shown by the lower uptake affinity
for nitrate than for ammonium (Lee and Dunton,
1999b), and by the higher uptake rates for ammonium than for nitrate when both were present (Short
and McRoy, 1984; Terrados and Williams, 1997; Lee
and Dunton, 1999b; Lepoint et al., 2002b). These
findings are consistent with the elevated cost of nitrate assimilation (Thacker and Syrett, 1972; Lara
et al., 1987; Turpin, 1991 and see below).
Few phosphate uptake kinetic studies are available
in the literature but they show a phosphate affinity in
the same order of magnitude as that for ammonium,
although data for phosphorus uptake were not always
obtained for the same species as for nitrogen uptake
(Table 1).
In general, much higher uptake affinities and uptake rates (higher V max and/or lower Km) were observed for leaves than for roots, which is consistent
with the nutrient concentrations of their respective
surrounding waters. These nutrient uptake kinetics
patterns seems to reflect plant adaptations to partition nutrient acquisition between two media with
contrasting nutrient availability.
3. Diffusive Boundary Layers
At least two additional aspects have to be considered in relation to leaf nutrient uptake by seagrasses.
First, the resistance to nutrient uptake induced by
J. Romero, K.-S. Lee, M. P ´
erez, M. A. Mateo, and T. Alcoverro
Table 1. Compilation of published kinetic parameters of nutrient uptake. V max is the uptake nutrient rate at saturating nutrient
concentration, and Km is the concentration at which a rate of V max /2 is reached. α is the uptake efficiency at low-nutrient
concentrations.
Species
Nutrient Organ
Km (µM)
V max (µmol g
−1 h
−1 )
α (l g
−1 h
−1 )
Source
Zostera marina
NO
−
3
Leaves
23
Iizumi and Hattori
(1982)
Phyllospadix torreyi
Leaves
8.69
46.67
Terrados and
Williams (1997)
Thalassia
testudinum
Leaves
2.2–38.5
3.7–6.5
0.15–1.68
Lee and Dunton
(1999b)
Zostera marina
NH
+
4
Leaves
1.05–3.18
Short and McRoy
(1984)
Roots
0.88–2.93
Zostera marina
Leaves
9.2
20.5
2.2
Thursby and Harlin
(1984)
Roots
104
211
0.5
Thalassia
hemprichii
Leaves
21–60
32–37
0.52–0.85
Stapel et al. (1996)
Amphibolis
antarctica
Leaves
9.5–74.3
5.9–43.1
0.6–0.8
Pedersen et al. (1997)
Roots
4.7
1.1
0.2
Phyllospadix torreyi
Leaves
14.24
110.16
Terrados and
Williams (1997)
Thalassia
testudinum
Leaves
7.6–15
8.3–16.4
0.57–2.82
Lee and Dunton
(1999b)
Roots
34.4–
765.5
7.9–73.3
0.03–0.3
Zostera noltii
PO
3−
4
Leaves
12.1
43
1.1
P´ erez-Llor´ ens and
Niell (1995)
Thalassia
hemprichii
Leaves
7.7–15
2.2–3.2
0.12–0.19
Stapel et al. (1996)
Thalassia
testudinum
Leaves
11.9
1.9
0.23
Gras et al. (2003)
Roots
3.7
0.57
0.10
kinetics, although scarce, are available in the literature. Nutrient uptake rates are usually measured at
various nutrient concentrations, plotted as a function of such concentrations and then kinetic parameters are derived using the Michaelis–Menten
equation. Results from various uptake studies on
several seagrass species showed that both leaf and
root tissues were capable of significant nutrient uptake, although kinetic parameters were highly variable among species, and between different plant organs (Table 1). Ammonium seems the preferred form
for N uptake, as shown by the lower uptake affinity
for nitrate than for ammonium (Lee and Dunton,
1999b), and by the higher uptake rates for ammonium than for nitrate when both were present (Short
and McRoy, 1984; Terrados and Williams, 1997; Lee
and Dunton, 1999b; Lepoint et al., 2002b). These
findings are consistent with the elevated cost of nitrate assimilation (Thacker and Syrett, 1972; Lara
et al., 1987; Turpin, 1991 and see below).
Few phosphate uptake kinetic studies are available
in the literature but they show a phosphate affinity in
the same order of magnitude as that for ammonium,
although data for phosphorus uptake were not always
obtained for the same species as for nitrogen uptake
(Table 1).
In general, much higher uptake affinities and uptake rates (higher V max and/or lower Km) were observed for leaves than for roots, which is consistent
with the nutrient concentrations of their respective
surrounding waters. These nutrient uptake kinetics
patterns seems to reflect plant adaptations to partition nutrient acquisition between two media with
contrasting nutrient availability.
3. Diffusive Boundary Layers
At least two additional aspects have to be considered in relation to leaf nutrient uptake by seagrasses.
First, the resistance to nutrient uptake induced by