

160
M. A. Mateo, J. Cebri ´
an, K. Dunton, and T. Mutchler
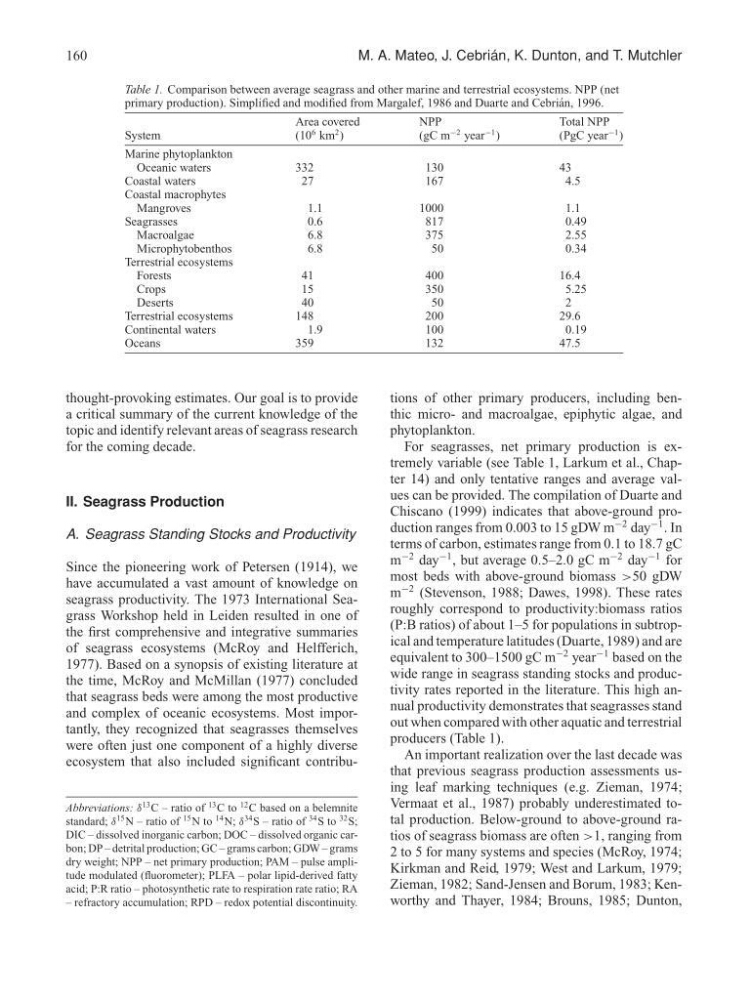
Table 1. Comparison between average seagrass and other marine and terrestrial ecosystems. NPP (net
primary production). Simplified and modified from Margalef, 1986 and Duarte and Cebri´ an, 1996.
Area covered
NPP
Total NPP
System
(10
6 km
2 )
(gC m
−2 year
−1 )
(PgC year
−1 )
Marine phytoplankton
Oceanic waters
332
130
43
Coastal waters
27
167
4.5
Coastal macrophytes
Mangroves
1.1
1000
1.1
Seagrasses
0.6
817
0.49
Macroalgae
6.8
375
2.55
Microphytobenthos
6.8
50
0.34
Terrestrial ecosystems
Forests
41
400
16.4
Crops
15
350
5.25
Deserts
40
50
2
Terrestrial ecosystems
148
200
29.6
Continental waters
1.9
100
0.19
Oceans
359
132
47.5
thought-provoking estimates. Our goal is to provide
a critical summary of the current knowledge of the
topic and identify relevant areas of seagrass research
for the coming decade.
II. Seagrass Production
A. Seagrass Standing Stocks and Productivity
Since the pioneering work of Petersen (1914), we
have accumulated a vast amount of knowledge on
seagrass productivity. The 1973 International Seagrass Workshop held in Leiden resulted in one of
the first comprehensive and integrative summaries
of seagrass ecosystems (McRoy and Helfferich,
1977). Based on a synopsis of existing literature at
the time, McRoy and McMillan (1977) concluded
that seagrass beds were among the most productive
and complex of oceanic ecosystems. Most importantly, they recognized that seagrasses themselves
were often just one component of a highly diverse
ecosystem that also included significant contribuAbbreviations: δ
13 C – ratio of
13 C to
12 C based on a belemnite
standard; δ
15 N – ratio of
15 N to
14 N; δ
34 S – ratio of
34 S to
32 S;
DIC – dissolved inorganic carbon; DOC – dissolved organic carbon; DP – detrital production; GC – grams carbon; GDW – grams
dry weight; NPP – net primary production; PAM – pulse amplitude modulated (fluorometer); PLFA – polar lipid-derived fatty
acid; P:R ratio – photosynthetic rate to respiration rate ratio; RA
– refractory accumulation; RPD – redox potential discontinuity.
tions of other primary producers, including benthic micro- and macroalgae, epiphytic algae, and
phytoplankton.
For seagrasses, net primary production is extremely variable (see Table 1, Larkum et al., Chapter 14) and only tentative ranges and average values can be provided. The compilation of Duarte and
Chiscano (1999) indicates that above-ground production ranges from 0.003 to 15 gDW m
−2 day
−1 . In
terms of carbon, estimates range from 0.1 to 18.7 gC
m
−2 day
−1 , but average 0.5–2.0 gC m
−2 day
−1 for
most beds with above-ground biomass >50 gDW
m
−2 (Stevenson, 1988; Dawes, 1998). These rates
roughly correspond to productivity:biomass ratios
(P:B ratios) of about 1–5 for populations in subtropical and temperature latitudes (Duarte, 1989) and are
equivalent to 300–1500 gC m
−2 year
−1 based on the
wide range in seagrass standing stocks and productivity rates reported in the literature. This high annual productivity demonstrates that seagrasses stand
out when compared with other aquatic and terrestrial
producers (Table 1).
An important realization over the last decade was
that previous seagrass production assessments using leaf marking techniques (e.g. Zieman, 1974;
Vermaat et al., 1987) probably underestimated total production. Below-ground to above-ground ratios of seagrass biomass are often >1, ranging from
2 to 5 for many systems and species (McRoy, 1974;
Kirkman and Reid, 1979; West and Larkum, 1979;
Zieman, 1982; Sand-Jensen and Borum, 1983; Kenworthy and Thayer, 1984; Brouns, 1985; Dunton,
M. A. Mateo, J. Cebri ´
an, K. Dunton, and T. Mutchler
Table 1. Comparison between average seagrass and other marine and terrestrial ecosystems. NPP (net
primary production). Simplified and modified from Margalef, 1986 and Duarte and Cebri´ an, 1996.
Area covered
NPP
Total NPP
System
(10
6 km
2 )
(gC m
−2 year
−1 )
(PgC year
−1 )
Marine phytoplankton
Oceanic waters
332
130
43
Coastal waters
27
167
4.5
Coastal macrophytes
Mangroves
1.1
1000
1.1
Seagrasses
0.6
817
0.49
Macroalgae
6.8
375
2.55
Microphytobenthos
6.8
50
0.34
Terrestrial ecosystems
Forests
41
400
16.4
Crops
15
350
5.25
Deserts
40
50
2
Terrestrial ecosystems
148
200
29.6
Continental waters
1.9
100
0.19
Oceans
359
132
47.5
thought-provoking estimates. Our goal is to provide
a critical summary of the current knowledge of the
topic and identify relevant areas of seagrass research
for the coming decade.
II. Seagrass Production
A. Seagrass Standing Stocks and Productivity
Since the pioneering work of Petersen (1914), we
have accumulated a vast amount of knowledge on
seagrass productivity. The 1973 International Seagrass Workshop held in Leiden resulted in one of
the first comprehensive and integrative summaries
of seagrass ecosystems (McRoy and Helfferich,
1977). Based on a synopsis of existing literature at
the time, McRoy and McMillan (1977) concluded
that seagrass beds were among the most productive
and complex of oceanic ecosystems. Most importantly, they recognized that seagrasses themselves
were often just one component of a highly diverse
ecosystem that also included significant contribuAbbreviations: δ
13 C – ratio of
13 C to
12 C based on a belemnite
standard; δ
15 N – ratio of
15 N to
14 N; δ
34 S – ratio of
34 S to
32 S;
DIC – dissolved inorganic carbon; DOC – dissolved organic carbon; DP – detrital production; GC – grams carbon; GDW – grams
dry weight; NPP – net primary production; PAM – pulse amplitude modulated (fluorometer); PLFA – polar lipid-derived fatty
acid; P:R ratio – photosynthetic rate to respiration rate ratio; RA
– refractory accumulation; RPD – redox potential discontinuity.
tions of other primary producers, including benthic micro- and macroalgae, epiphytic algae, and
phytoplankton.
For seagrasses, net primary production is extremely variable (see Table 1, Larkum et al., Chapter 14) and only tentative ranges and average values can be provided. The compilation of Duarte and
Chiscano (1999) indicates that above-ground production ranges from 0.003 to 15 gDW m
−2 day
−1 . In
terms of carbon, estimates range from 0.1 to 18.7 gC
m
−2 day
−1 , but average 0.5–2.0 gC m
−2 day
−1 for
most beds with above-ground biomass >50 gDW
m
−2 (Stevenson, 1988; Dawes, 1998). These rates
roughly correspond to productivity:biomass ratios
(P:B ratios) of about 1–5 for populations in subtropical and temperature latitudes (Duarte, 1989) and are
equivalent to 300–1500 gC m
−2 year
−1 based on the
wide range in seagrass standing stocks and productivity rates reported in the literature. This high annual productivity demonstrates that seagrasses stand
out when compared with other aquatic and terrestrial
producers (Table 1).
An important realization over the last decade was
that previous seagrass production assessments using leaf marking techniques (e.g. Zieman, 1974;
Vermaat et al., 1987) probably underestimated total production. Below-ground to above-ground ratios of seagrass biomass are often >1, ranging from
2 to 5 for many systems and species (McRoy, 1974;
Kirkman and Reid, 1979; West and Larkum, 1979;
Zieman, 1982; Sand-Jensen and Borum, 1983; Kenworthy and Thayer, 1984; Brouns, 1985; Dunton,