

Conclusions
seagrasses
macroalgae
phytoplankton
seagrasses
macroalgae
phytoplankton
0.001
0.1
10
1000
0.001
0.01
0.1
biomass (g m-2 )
0.00001
0.001
0.1
grazing rate
(% biomass grazed day -1)
0.001
turnover (day -1)
0.01
decomposition rate
( In units day -. )
455
0.1
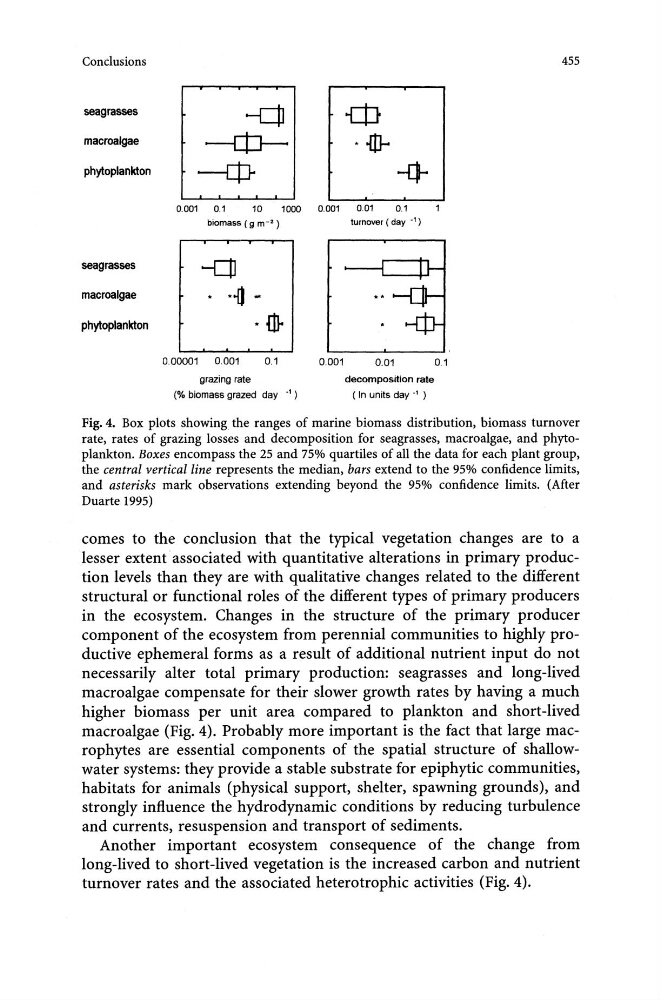
Fig. 4. Box plots showing the ranges of marine biomass distribution, biomass turnover
rate, rates of grazing losses and decomposition for seagrasses, macro algae, and phytoplankton. Boxes encompass the 25 and 75% quartiles of all the data for each plant group,
the central vertical line represents the median, bars extend to the 95% confidence limits,
and asterisks mark observations extending beyond the 95% confidence limits. (After
Duarte 1995)
comes to the conclusion that the typical vegetation changes are to a
lesser extent associated with quantitative alterations in primary production levels than they are with qualitative changes related to the different
structural or functional roles of the different types of primary producers
in the ecosystem. Changes in the structure of the primary producer
component of the ecosystem from perennial communities to highly productive ephemeral forms as a result of additional nutrient input do not
necessarily alter total primary production: seagrasses and long-lived
macro algae compensate for their slower growth rates by having a much
higher biomass per unit area compared to plankton and short-lived
macroalgae (Fig. 4). Probably more important is the fact that large macrophytes are essential components of the spatial structure of shallowwater systems: they provide a stable substrate for epiphytic communities,
habitats for animals (physical support, shelter, spawning grounds), and
strongly influence the hydrodynamic conditions by reducing turbulence
and currents, resuspension and transport of sediments.
Another important ecosystem consequence of the change from
long-lived to short-lived vegetation is the increased carbon and nutrient
turnover rates and the associated heterotrophic activities (Fig. 4).
seagrasses
macroalgae
phytoplankton
seagrasses
macroalgae
phytoplankton
0.001
0.1
10
1000
0.001
0.01
0.1
biomass (g m-2 )
0.00001
0.001
0.1
grazing rate
(% biomass grazed day -1)
0.001
turnover (day -1)
0.01
decomposition rate
( In units day -. )
455
0.1
Fig. 4. Box plots showing the ranges of marine biomass distribution, biomass turnover
rate, rates of grazing losses and decomposition for seagrasses, macro algae, and phytoplankton. Boxes encompass the 25 and 75% quartiles of all the data for each plant group,
the central vertical line represents the median, bars extend to the 95% confidence limits,
and asterisks mark observations extending beyond the 95% confidence limits. (After
Duarte 1995)
comes to the conclusion that the typical vegetation changes are to a
lesser extent associated with quantitative alterations in primary production levels than they are with qualitative changes related to the different
structural or functional roles of the different types of primary producers
in the ecosystem. Changes in the structure of the primary producer
component of the ecosystem from perennial communities to highly productive ephemeral forms as a result of additional nutrient input do not
necessarily alter total primary production: seagrasses and long-lived
macro algae compensate for their slower growth rates by having a much
higher biomass per unit area compared to plankton and short-lived
macroalgae (Fig. 4). Probably more important is the fact that large macrophytes are essential components of the spatial structure of shallowwater systems: they provide a stable substrate for epiphytic communities,
habitats for animals (physical support, shelter, spawning grounds), and
strongly influence the hydrodynamic conditions by reducing turbulence
and currents, resuspension and transport of sediments.
Another important ecosystem consequence of the change from
long-lived to short-lived vegetation is the increased carbon and nutrient
turnover rates and the associated heterotrophic activities (Fig. 4).