

The Northern Adriatic Sea
373
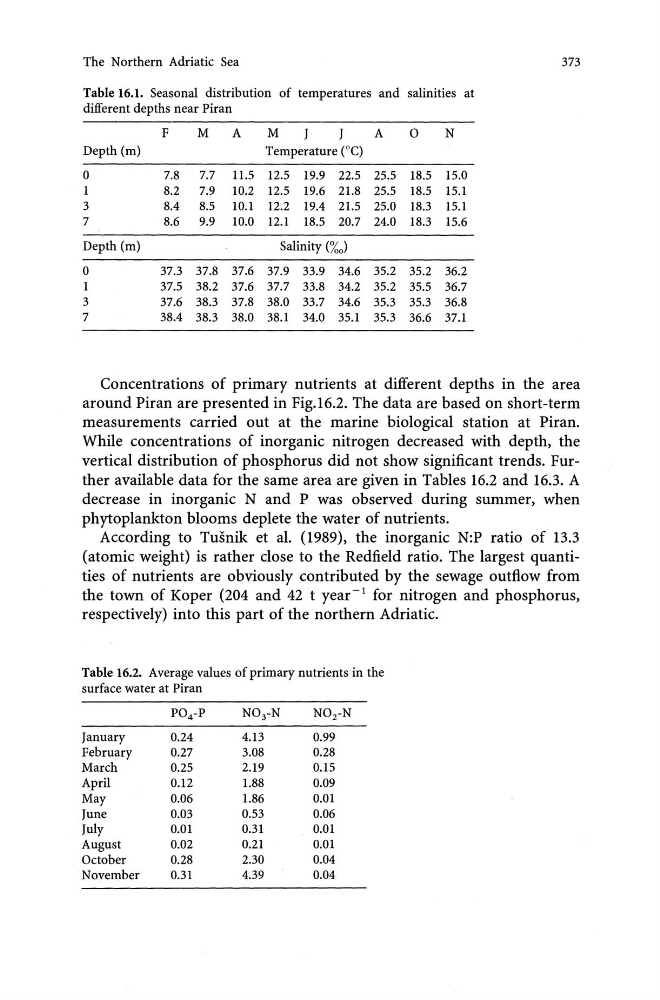
Table 16.1. Seasonal distribution of temperatures and salinities at
different depths near Piran
F
M
A
M
J
J
A
0
N
Depth (m)
Temperature (DC)
0
7.8
7.7 11.5 12.5 19.9 22.5 25.5 18.5 15.0
1
8.2
7.9 10.2 12.5 19.6 21.8 25.5 18.5 15.1
3
8.4
8.5 10.1 12.2 19.4 21.5 25.0 18.3 15.1
7
8.6
9.9 10.0 12.1 18.5 20.7 24.0 18.3 15.6
Depth (m)
Salinity (%0)
0
37.3 37.8 37.6 37.9 33.9 34.6 35.2 35.2 36.2
1
37.5 38.2 37.6 37.7 33.8 34.2 35.2 35.5 36.7
3
37.6 38.3 37.8 38.0 33.7 34.6 35.3 35.3 36.8
7
38.4 38.3 38.0 38.1 34.0 35.1 35.3 36.6 37.1
Concentrations of primary nutrients at different depths in the area
around Piran are presented in Fig.16.2. The data are based on short-term
measurements carried out at the marine biological station at Piran.
While concentrations of inorganic nitrogen decreased with depth, the
vertical distribution of phosphorus did not show significant trends. Further available data for the same area are given in Tables 16.2 and 16.3. A
decrease in inorganic Nand P was observed during summer, when
phytoplankton blooms deplete the water of nutrients.
According to Tusnik et al. (1989), the inorganic N:P ratio of 13.3
(atomic weight) is rather close to the Redfield ratio. The largest quantities of nutrients are obviously contributed by the sewage outflow from
the town of Koper (204 and 42 t year- 1 for nitrogen and phosphorus,
respectively) into this part of the northern Adriatic.
Table 16.2. Average values of primary nutrients in the
surface water at Piran
P04 -P
N0 3 -N
N02 -N
January
0.24
4.13
0.99
February
0.27
3.08
0.28
March
0.25
2.19
0.15
April
0.12
1.88
0.09
May
0.06
1.86
0.01
June
0.03
0.53
0.06
July
0.01
0.31
O.oI
August
0.02
0.21
O.oI
October
0.28
2.30
0.04
November
0.31
4.39
0.04
373
Table 16.1. Seasonal distribution of temperatures and salinities at
different depths near Piran
F
M
A
M
J
J
A
0
N
Depth (m)
Temperature (DC)
0
7.8
7.7 11.5 12.5 19.9 22.5 25.5 18.5 15.0
1
8.2
7.9 10.2 12.5 19.6 21.8 25.5 18.5 15.1
3
8.4
8.5 10.1 12.2 19.4 21.5 25.0 18.3 15.1
7
8.6
9.9 10.0 12.1 18.5 20.7 24.0 18.3 15.6
Depth (m)
Salinity (%0)
0
37.3 37.8 37.6 37.9 33.9 34.6 35.2 35.2 36.2
1
37.5 38.2 37.6 37.7 33.8 34.2 35.2 35.5 36.7
3
37.6 38.3 37.8 38.0 33.7 34.6 35.3 35.3 36.8
7
38.4 38.3 38.0 38.1 34.0 35.1 35.3 36.6 37.1
Concentrations of primary nutrients at different depths in the area
around Piran are presented in Fig.16.2. The data are based on short-term
measurements carried out at the marine biological station at Piran.
While concentrations of inorganic nitrogen decreased with depth, the
vertical distribution of phosphorus did not show significant trends. Further available data for the same area are given in Tables 16.2 and 16.3. A
decrease in inorganic Nand P was observed during summer, when
phytoplankton blooms deplete the water of nutrients.
According to Tusnik et al. (1989), the inorganic N:P ratio of 13.3
(atomic weight) is rather close to the Redfield ratio. The largest quantities of nutrients are obviously contributed by the sewage outflow from
the town of Koper (204 and 42 t year- 1 for nitrogen and phosphorus,
respectively) into this part of the northern Adriatic.
Table 16.2. Average values of primary nutrients in the
surface water at Piran
P04 -P
N0 3 -N
N02 -N
January
0.24
4.13
0.99
February
0.27
3.08
0.28
March
0.25
2.19
0.15
April
0.12
1.88
0.09
May
0.06
1.86
0.01
June
0.03
0.53
0.06
July
0.01
0.31
O.oI
August
0.02
0.21
O.oI
October
0.28
2.30
0.04
November
0.31
4.39
0.04