

358
A. Sfriso and A. Marcomini
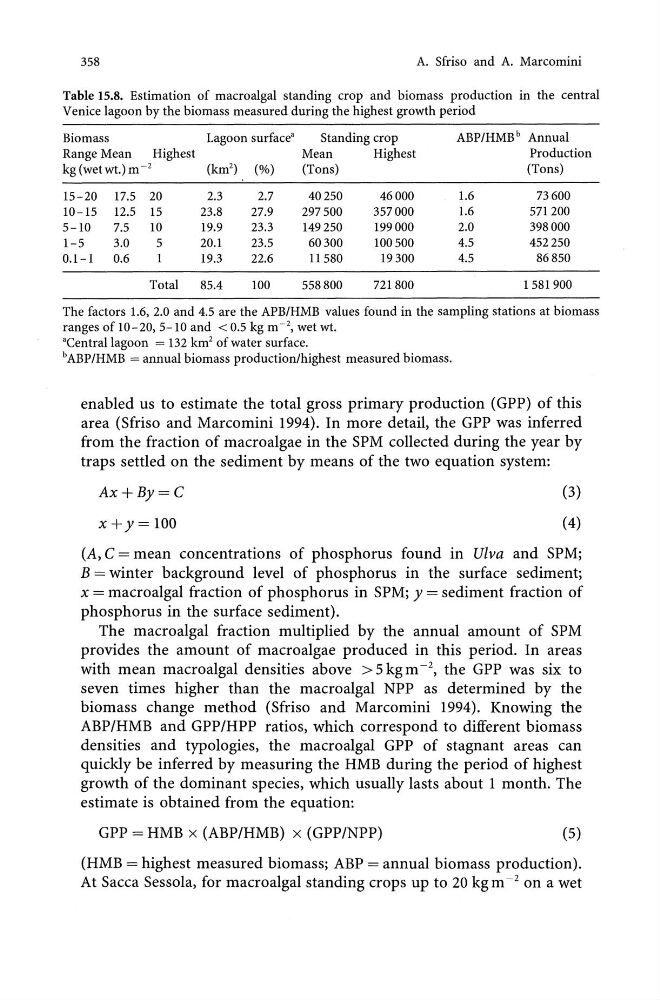
Table 15.8. Estimation of macroalgal standing crop and biomass production in the central
Venice lagoon by the biomass measured during the highest growth period
Biomass
Lagoon surface"
Standing crop
ABP/HMB b Annual
Range Mean
Highest
Mean
Highest
Production
kg (wetwt.) m- 2
(km 2 ) (%)
(Tons)
(Tons)
15-20 17.5 20
2.3
2.7
40250
46000
1.6
73600
10-15 12.5 15
23.8
27.9
297500
357000
1.6
571200
5-10
7.5
10
19.9
23.3
149250
199000
2.0
398000
1-5
3.0
5
20.1
23.5
60300
100500
4.5
452250
0.1-1
0.6
19.3
22.6
11580
19300
4.5
86850
Total
85.4
100
558800
721800
1581900
The factors 1.6, 2.0 and 4.5 are the APB/HMB values found in the sampling stations at biomass
ranges of 10 - 20, 5-10 and < 0.5 kg m -2, wet wt.
"Centrallagoon = 132 km 2 of water surface.
bABP/HMB = annual biomass productionlhighest measured biomass.
enabled us to estimate the total gross primary production (GPP) of this
area (Sfriso and Marcomini 1994). In more detail, the GPP was inferred
from the fraction of macroalgae in the SPM collected during the year by
traps settled on the sediment by means of the two equation system:
Ax+By=C
x+y=100
(3)
(4)
(A, C = mean concentrations of phosphorus found in Uiva and SPM;
B = winter background level of phosphorus in the surface sediment;
x = macroalgal fraction of phosphorus in SPM; y = sediment fraction of
phosphorus in the surface sediment).
The macroalgal fraction mUltiplied by the annual amount of SPM
provides the amount of macro algae produced in this period. In areas
with mean macroalgal densities above >5kgm- 2 , the GPP was six to
seven times higher than the macroalgal NPP as determined by the
biomass change method (Sfriso and Marcomini 1994). Knowing the
ABP/HMB and GPP/HPP ratios, which correspond to different biomass
densities and typologies, the macroalgal GPP of stagnant areas can
quickly be inferred by measuring the HMB during the period of highest
growth of the dominant species, which usually lasts about 1 month. The
estimate is obtained from the equation:
GPP = HMB x (ABP/HMB) x (GPP/NPP)
(5)
(HMB = highest measured biomass; ABP = annual biomass production).
At Sacca Sessola, for macro algal standing crops up to 20 kg m -2 on a wet
A. Sfriso and A. Marcomini
Table 15.8. Estimation of macroalgal standing crop and biomass production in the central
Venice lagoon by the biomass measured during the highest growth period
Biomass
Lagoon surface"
Standing crop
ABP/HMB b Annual
Range Mean
Highest
Mean
Highest
Production
kg (wetwt.) m- 2
(km 2 ) (%)
(Tons)
(Tons)
15-20 17.5 20
2.3
2.7
40250
46000
1.6
73600
10-15 12.5 15
23.8
27.9
297500
357000
1.6
571200
5-10
7.5
10
19.9
23.3
149250
199000
2.0
398000
1-5
3.0
5
20.1
23.5
60300
100500
4.5
452250
0.1-1
0.6
19.3
22.6
11580
19300
4.5
86850
Total
85.4
100
558800
721800
1581900
The factors 1.6, 2.0 and 4.5 are the APB/HMB values found in the sampling stations at biomass
ranges of 10 - 20, 5-10 and < 0.5 kg m -2, wet wt.
"Centrallagoon = 132 km 2 of water surface.
bABP/HMB = annual biomass productionlhighest measured biomass.
enabled us to estimate the total gross primary production (GPP) of this
area (Sfriso and Marcomini 1994). In more detail, the GPP was inferred
from the fraction of macroalgae in the SPM collected during the year by
traps settled on the sediment by means of the two equation system:
Ax+By=C
x+y=100
(3)
(4)
(A, C = mean concentrations of phosphorus found in Uiva and SPM;
B = winter background level of phosphorus in the surface sediment;
x = macroalgal fraction of phosphorus in SPM; y = sediment fraction of
phosphorus in the surface sediment).
The macroalgal fraction mUltiplied by the annual amount of SPM
provides the amount of macro algae produced in this period. In areas
with mean macroalgal densities above >5kgm- 2 , the GPP was six to
seven times higher than the macroalgal NPP as determined by the
biomass change method (Sfriso and Marcomini 1994). Knowing the
ABP/HMB and GPP/HPP ratios, which correspond to different biomass
densities and typologies, the macroalgal GPP of stagnant areas can
quickly be inferred by measuring the HMB during the period of highest
growth of the dominant species, which usually lasts about 1 month. The
estimate is obtained from the equation:
GPP = HMB x (ABP/HMB) x (GPP/NPP)
(5)
(HMB = highest measured biomass; ABP = annual biomass production).
At Sacca Sessola, for macro algal standing crops up to 20 kg m -2 on a wet