

352
A. Sfriso and A. Marcomini
areas of the lagoon characterized by different species and biomass densities. Significant biomass variations between successive sampling
periods were determined by applying variance analysis at the 0.01 probability level to each series of annual mean biomass values. This allowed
the estimation of daily and yearly net biomass production/degradation
rates (Table 1S.6). Taking into account the percent dry to wet weight
ratio and the mean carbon (C), nitrogen (N) and phosphorus (P) contents of the biomass involved (Table IS.7), the assimilation rates and the
amount of P and N uptake or release by macroalgae were also calculated
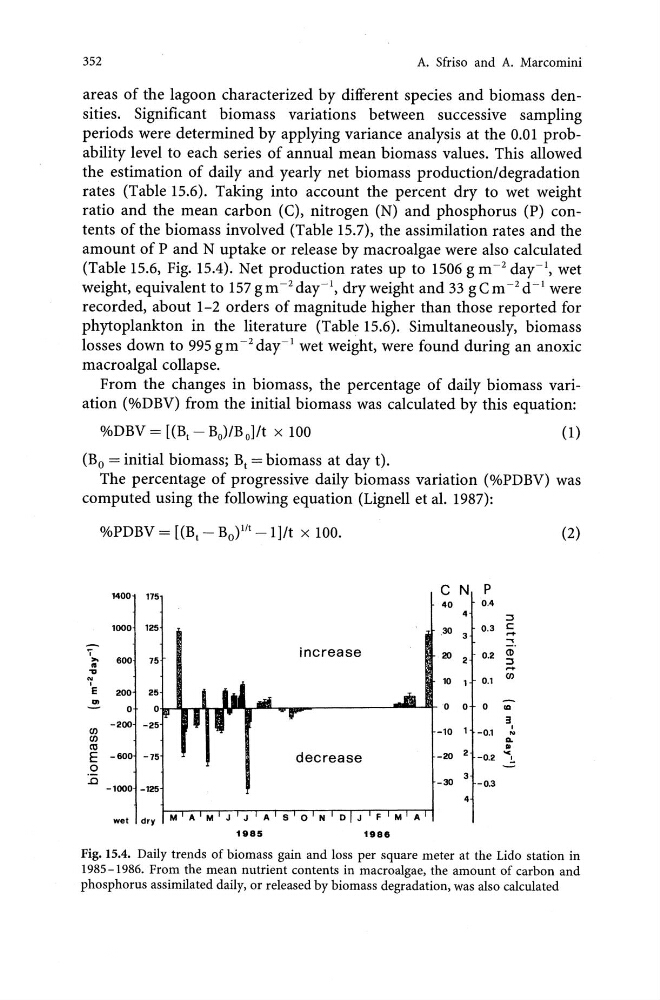
(Table 1S.6, Fig. IS.4). Net production rates up to IS06 g m- 2 day-I, wet
weight, equivalent to IS7 g m -2 day-I, dry weight and 33 gem -2 d -I were
recorded, about 1-2 orders of magnitude higher than those reported for
phytoplankton in the literature (Table 1S.6). Simultaneously, biomass
losses down to 99S g m -2 day-I wet weight, were found during an anoxic
macroalgal collapse.
From the changes in biomass, the percentage of daily biomass variation (O/ODBV) from the initial biomass was calculated by this equation:
(1)
(Bo = initial biomass; B t = biomass at day t).
The percentage of progressive daily biomass variation (O/OPDBV) was
computed using the following equation (Lignell et al. 1987):
O/OPDBV = [(B t - Bo)lIt -11/t x 100.
(2)
1400
175
c N P
40
0.4
4
::J
1000 125
30
0.3 s::::
3
- ....
';
increase
,., 600 75
II
20
0.2 CD
2
::J
-
....
"i
10
0.1
CJ)
1
E
200
25
'" 0
-
0
0
0
II>
-200
CJ)
3
-10 1 -0.1
I
N
CJ)
Do
(1l
E -600 -75
decrease
. .
-20 2 -0.2
... !.
0
.0 -1000 -125
-30
3 -0.3
4
wet dry
M A M J
J
A
S 0 N
0
J
F
M A
1985
1988
Fig. 15.4. Daily trends of biomass gain and loss per square meter at the Lido station in
1985-1986. From the mean nutrient contents in macroalgae, the amount of carbon and
phosphorus assimilated daily, or released by biomass degradation, was also calculated
A. Sfriso and A. Marcomini
areas of the lagoon characterized by different species and biomass densities. Significant biomass variations between successive sampling
periods were determined by applying variance analysis at the 0.01 probability level to each series of annual mean biomass values. This allowed
the estimation of daily and yearly net biomass production/degradation
rates (Table 1S.6). Taking into account the percent dry to wet weight
ratio and the mean carbon (C), nitrogen (N) and phosphorus (P) contents of the biomass involved (Table IS.7), the assimilation rates and the
amount of P and N uptake or release by macroalgae were also calculated
(Table 1S.6, Fig. IS.4). Net production rates up to IS06 g m- 2 day-I, wet
weight, equivalent to IS7 g m -2 day-I, dry weight and 33 gem -2 d -I were
recorded, about 1-2 orders of magnitude higher than those reported for
phytoplankton in the literature (Table 1S.6). Simultaneously, biomass
losses down to 99S g m -2 day-I wet weight, were found during an anoxic
macroalgal collapse.
From the changes in biomass, the percentage of daily biomass variation (O/ODBV) from the initial biomass was calculated by this equation:
(1)
(Bo = initial biomass; B t = biomass at day t).
The percentage of progressive daily biomass variation (O/OPDBV) was
computed using the following equation (Lignell et al. 1987):
O/OPDBV = [(B t - Bo)lIt -11/t x 100.
(2)
1400
175
c N P
40
0.4
4
::J
1000 125
30
0.3 s::::
3
- ....
';
increase
,., 600 75
II
20
0.2 CD
2
::J
-
....
"i
10
0.1
CJ)
1
E
200
25
'" 0
-
0
0
0
II>
-200
CJ)
3
-10 1 -0.1
I
N
CJ)
Do
(1l
E -600 -75
decrease
. .
-20 2 -0.2
... !.
0
.0 -1000 -125
-30
3 -0.3
4
wet dry
M A M J
J
A
S 0 N
0
J
F
M A
1985
1988
Fig. 15.4. Daily trends of biomass gain and loss per square meter at the Lido station in
1985-1986. From the mean nutrient contents in macroalgae, the amount of carbon and
phosphorus assimilated daily, or released by biomass degradation, was also calculated