

The Spanish Mediterranean Coasts
301
......
... I E
;,
'V
CI'
.....
iii
iii
0
E
0
iii
- .c
CJI
..
•
" •
. ~
'0
e
. .
0
z
260
200
150
100
50
0
6
4
3
2
DJF'UAMJJASONDJ
1988
C conlro'
AP
VN
o N+P
rUAU
1989
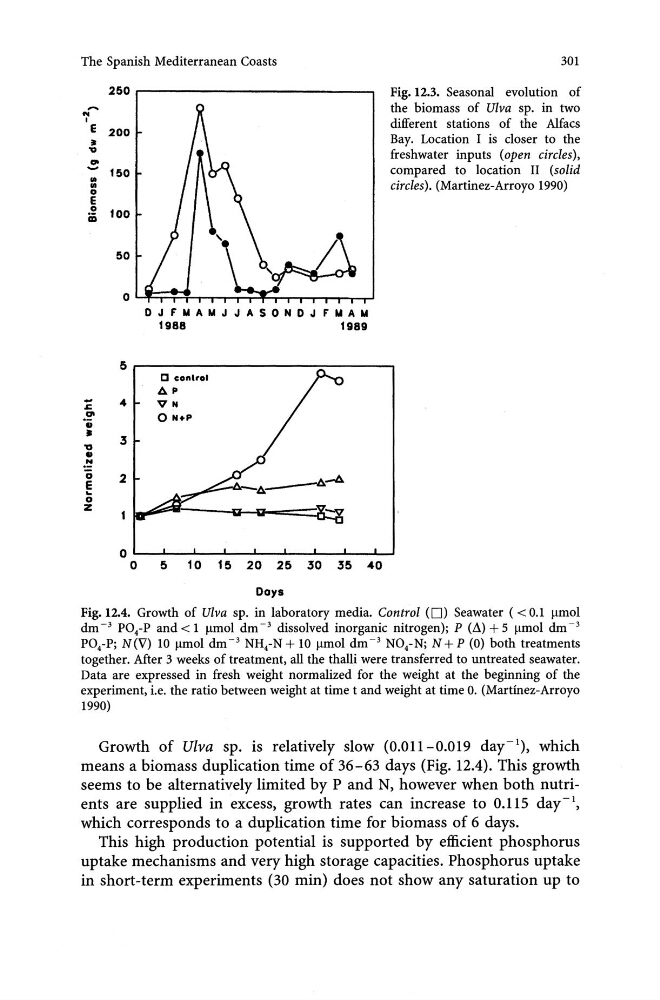
Fig. 12.3. Seasonal evolution of
the biomass of Ulva sp. in two
different stations of the Alfacs
Bay. Location I is closer to the
freshwater inputs (open circles),
compared to location II (solid
circles). (Martinez-Arroyo 1990)
O~~--~~--~--L-~--~~~
o 5 10 15 20 25 30 35 40
Days
Fig. 12.4. Growth of Ulva sp. in laboratory media. Control (0) Seawater ( < 0.1 Ilmol
dm -3 P0 4 -P and < 1 Ilmol dm -3 dissolved inorganic nitrogen); P (~) + 5 /lffiol dm- 3
P0 4 -P; N(V) 10 /lffiol dm- 3 NH 4 -N + 10 Ilmol dm- 3 N0 4 -N; N +P (0) both treatments
together. After 3 weeks of treatment, all the thalli were transferred to untreated seawater.
Data are expressed in fresh weight normalized for the weight at the beginning of the
experiment, i.e. the ratio between weight at time t and weight at time o. (Martinez-Arroyo
1990)
Growth of Ulva sp. is relatively slow (0.011- 0.019 day -1), which
means a biomass duplication time of 36-63 days (Fig. 12.4). This growth
seems to be alternatively limited by P and N, however when both nutrients are supplied in excess, growth rates can increase to 0.115 day-I,
which corresponds to a duplication time for biomass of 6 days.
This high production potential is supported by efficient phosphorus
uptake mechanisms and very high storage capacities. Phosphorus uptake
in short-term experiments (30 min) does not show any saturation up to
301
......
... I E
;,
'V
CI'
.....
iii
iii
0
E
0
iii
- .c
CJI
..
•
" •
. ~
'0
e
. .
0
z
260
200
150
100
50
0
6
4
3
2
DJF'UAMJJASONDJ
1988
C conlro'
AP
VN
o N+P
rUAU
1989
Fig. 12.3. Seasonal evolution of
the biomass of Ulva sp. in two
different stations of the Alfacs
Bay. Location I is closer to the
freshwater inputs (open circles),
compared to location II (solid
circles). (Martinez-Arroyo 1990)
O~~--~~--~--L-~--~~~
o 5 10 15 20 25 30 35 40
Days
Fig. 12.4. Growth of Ulva sp. in laboratory media. Control (0) Seawater ( < 0.1 Ilmol
dm -3 P0 4 -P and < 1 Ilmol dm -3 dissolved inorganic nitrogen); P (~) + 5 /lffiol dm- 3
P0 4 -P; N(V) 10 /lffiol dm- 3 NH 4 -N + 10 Ilmol dm- 3 N0 4 -N; N +P (0) both treatments
together. After 3 weeks of treatment, all the thalli were transferred to untreated seawater.
Data are expressed in fresh weight normalized for the weight at the beginning of the
experiment, i.e. the ratio between weight at time t and weight at time o. (Martinez-Arroyo
1990)
Growth of Ulva sp. is relatively slow (0.011- 0.019 day -1), which
means a biomass duplication time of 36-63 days (Fig. 12.4). This growth
seems to be alternatively limited by P and N, however when both nutrients are supplied in excess, growth rates can increase to 0.115 day-I,
which corresponds to a duplication time for biomass of 6 days.
This high production potential is supported by efficient phosphorus
uptake mechanisms and very high storage capacities. Phosphorus uptake
in short-term experiments (30 min) does not show any saturation up to