

The British Isles
239
nels of Dublin Bay whilst Anonymous (1976a) reported Ulva to
show its maximum growth in completely sheltered regions of Langstone
Harbour.
Although high nutrient loadings in association with sheltered localities
are generally the cause of the abundance and perennial nature of these
large algal mats (Soulsby et al. 1978; previously they were often described
as more annual and restricted in their occurrence; see Nicholls et al.
1981) and there are reports that in sites receiving more effluent the algal
growths occurred much earlier and became much denser (Anonymous
1976a), other environmental factors also play an important role. For
example, some authors have noted that the onset of rapid growth can
vary by up to a month from year to year (Montgomery and Soulsby
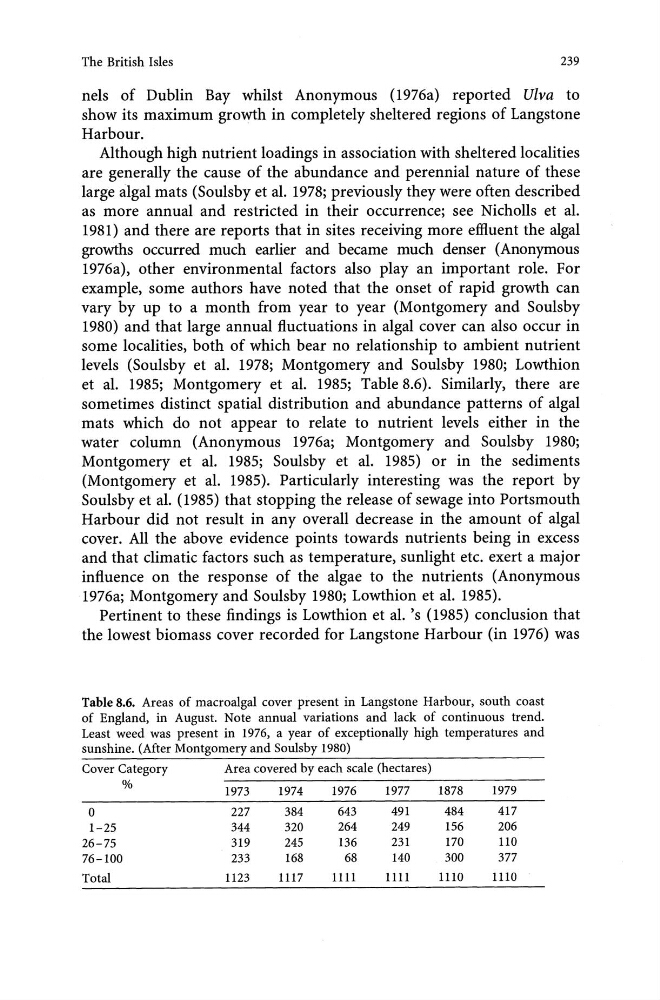
1980) and that large annual fluctuations in algal cover can also occur in
some localities, both of which bear no relationship to ambient nutrient
levels (Soulsby et al. 1978; Montgomery and Soulsby 1980; Lowthion
et al. 1985; Montgomery et al. 1985; Table 8.6). Similarly, there are
sometimes distinct spatial distribution and abundance patterns of algal
mats which do not appear to relate to nutrient levels either in the
water column (Anonymous 1976a; Montgomery and Soulsby 1980;
Montgomery et al. 1985; Soulsby et al. 1985) or in the sediments
(Montgomery et al. 1985). Particularly interesting was the report by
Soulsbyet al. (1985) that stopping the release of sewage into Portsmouth
Harbour did not result in any overall decrease in the amount of algal
cover. All the above evidence points towards nutrients being in excess
and that climatic factors such as temperature, sunlight etc. exert a major
influence on the response of the algae to the nutrients (Anonymous
1976a; Montgomery and Soulsby 1980; Lowthion et al. 1985).
Pertinent to these findings is Lowthion et al. 's (1985) conclusion that
the lowest biomass cover recorded for Langstone Harbour (in 1976) was
Table 8.6. Areas of macro algal cover present in Langstone Harbour, south coast
of England, in August. Note annual variations and lack of continuous trend.
Least weed was present in 1976, a year of exceptionally high temperatures and
sunshine. (After Montgomery and Soulsby 1980)
Cover Category
Area covered by each scale (hectares)
%
1973
1974
1976
1977
1878
1979
0
227
384
643
491
484
417
1-25
344
320
264
249
156
206
26-75
319
245
136
231
170
110
76-100
233
168
68
140
300
377
Total
1123
1117
1111
1111
1110
1110
239
nels of Dublin Bay whilst Anonymous (1976a) reported Ulva to
show its maximum growth in completely sheltered regions of Langstone
Harbour.
Although high nutrient loadings in association with sheltered localities
are generally the cause of the abundance and perennial nature of these
large algal mats (Soulsby et al. 1978; previously they were often described
as more annual and restricted in their occurrence; see Nicholls et al.
1981) and there are reports that in sites receiving more effluent the algal
growths occurred much earlier and became much denser (Anonymous
1976a), other environmental factors also play an important role. For
example, some authors have noted that the onset of rapid growth can
vary by up to a month from year to year (Montgomery and Soulsby
1980) and that large annual fluctuations in algal cover can also occur in
some localities, both of which bear no relationship to ambient nutrient
levels (Soulsby et al. 1978; Montgomery and Soulsby 1980; Lowthion
et al. 1985; Montgomery et al. 1985; Table 8.6). Similarly, there are
sometimes distinct spatial distribution and abundance patterns of algal
mats which do not appear to relate to nutrient levels either in the
water column (Anonymous 1976a; Montgomery and Soulsby 1980;
Montgomery et al. 1985; Soulsby et al. 1985) or in the sediments
(Montgomery et al. 1985). Particularly interesting was the report by
Soulsbyet al. (1985) that stopping the release of sewage into Portsmouth
Harbour did not result in any overall decrease in the amount of algal
cover. All the above evidence points towards nutrients being in excess
and that climatic factors such as temperature, sunlight etc. exert a major
influence on the response of the algae to the nutrients (Anonymous
1976a; Montgomery and Soulsby 1980; Lowthion et al. 1985).
Pertinent to these findings is Lowthion et al. 's (1985) conclusion that
the lowest biomass cover recorded for Langstone Harbour (in 1976) was
Table 8.6. Areas of macro algal cover present in Langstone Harbour, south coast
of England, in August. Note annual variations and lack of continuous trend.
Least weed was present in 1976, a year of exceptionally high temperatures and
sunshine. (After Montgomery and Soulsby 1980)
Cover Category
Area covered by each scale (hectares)
%
1973
1974
1976
1977
1878
1979
0
227
384
643
491
484
417
1-25
344
320
264
249
156
206
26-75
319
245
136
231
170
110
76-100
233
168
68
140
300
377
Total
1123
1117
1111
1111
1110
1110