

The Baltic Sea and Its Transition Zones
141
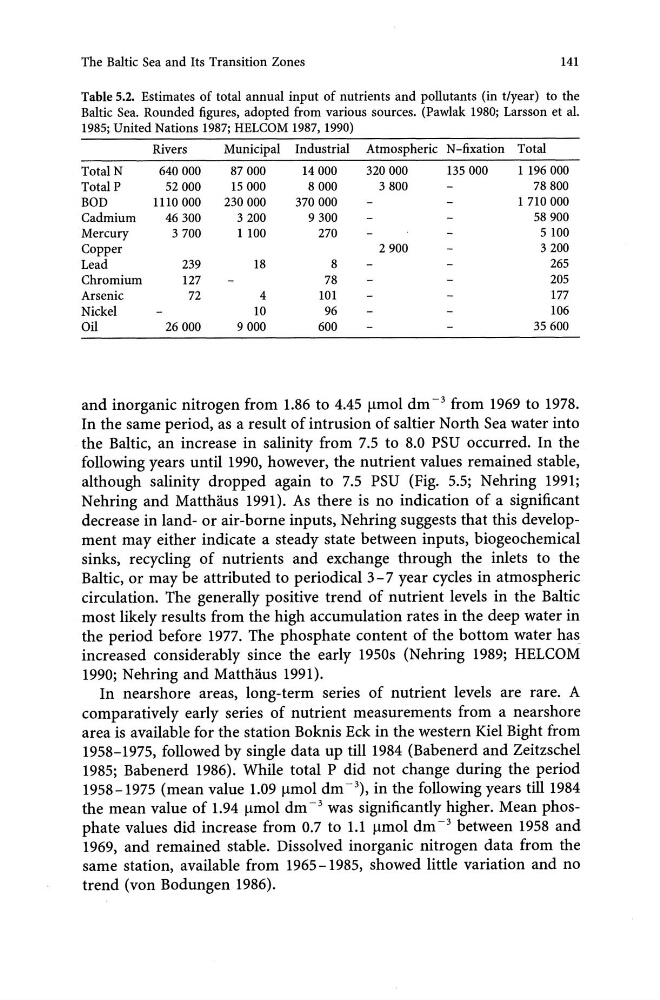
Table 5.2. Estimates of total annual input of nutrients and pollutants (in t/year) to the
Baltic Sea. Rounded figures, adopted from various sources. (Pawlak 1980; Larsson et al.
1985; United Nations 1987; HELCOM 1987, 1990)
Rivers
Municipal Industrial Atmospheric N-fixation Total
Total N
640000
87000
14000
320000
135000
1196000
Total P
52000
15000
8000
3800
78800
BOD
1110 000
230000
370000
1 710000
Cadmium
46300
3200
9300
58900
Mercury
3700
1lO0
270
5 lOO
Copper
2900
3200
Lead
239
18
8
265
Chromium
127
78
205
Arsenic
72
4
101
177
Nickel
10
96
lO6
Oil
26000
9000
600
35600
and inorganic nitrogen from 1.86 to 4.45 flmol dm -3 from 1969 to 1978.
In the same period, as a result of intrusion of saltier North Sea water into
the Baltic, an increase in salinity from 7.5 to 8.0 PSU occurred. In the
following years until 1990, however, the nutrient values remained stable,
although salinity dropped again to 7.5 PSU (Fig. 5.5; Nehring 1991;
Nehring and Matthaus 1991). As there is no indication of a significant
decrease in land- or air-borne inputs, Nehring suggests that this development may either indicate a steady state between inputs, biogeochemical
sinks, recycling of nutrients and exchange through the inlets to the
Baltic, or may be attributed to periodical 3 -7 year cycles in atmospheric
circulation. The generally positive trend of nutrient levels in the Baltic
most likely results from the high accumulation rates in the deep water in
the period before 1977. The phosphate content of the bottom water has
increased considerably since the early 1950s (Nehring 1989; HELCOM
1990; Nehring and Matthaus 1991).
In nearshore areas, long-term series of nutrient levels are rare. A
comparatively early series of nutrient measurements from a nearshore
area is available for the station Boknis Eck in the western Kiel Bight from
1958-1975, followed by single data up till 1984 (Babenerd and Zeitzschel
1985; Babenerd 1986). While total P did not change during the period
1958-1975 (mean value 1.09 flmol dm -3), in the following years till 1984
the mean value of 1.94 flmol dm- 3 was significantly higher. Mean phosphate values did increase from 0.7 to 1.1 flmol dm -3 between 1958 and
1969, and remained stable. Dissolved inorganic nitrogen data from the
same station, available from 1965-1985, showed little variation and no
trend (von Bodungen 1986).
141
Table 5.2. Estimates of total annual input of nutrients and pollutants (in t/year) to the
Baltic Sea. Rounded figures, adopted from various sources. (Pawlak 1980; Larsson et al.
1985; United Nations 1987; HELCOM 1987, 1990)
Rivers
Municipal Industrial Atmospheric N-fixation Total
Total N
640000
87000
14000
320000
135000
1196000
Total P
52000
15000
8000
3800
78800
BOD
1110 000
230000
370000
1 710000
Cadmium
46300
3200
9300
58900
Mercury
3700
1lO0
270
5 lOO
Copper
2900
3200
Lead
239
18
8
265
Chromium
127
78
205
Arsenic
72
4
101
177
Nickel
10
96
lO6
Oil
26000
9000
600
35600
and inorganic nitrogen from 1.86 to 4.45 flmol dm -3 from 1969 to 1978.
In the same period, as a result of intrusion of saltier North Sea water into
the Baltic, an increase in salinity from 7.5 to 8.0 PSU occurred. In the
following years until 1990, however, the nutrient values remained stable,
although salinity dropped again to 7.5 PSU (Fig. 5.5; Nehring 1991;
Nehring and Matthaus 1991). As there is no indication of a significant
decrease in land- or air-borne inputs, Nehring suggests that this development may either indicate a steady state between inputs, biogeochemical
sinks, recycling of nutrients and exchange through the inlets to the
Baltic, or may be attributed to periodical 3 -7 year cycles in atmospheric
circulation. The generally positive trend of nutrient levels in the Baltic
most likely results from the high accumulation rates in the deep water in
the period before 1977. The phosphate content of the bottom water has
increased considerably since the early 1950s (Nehring 1989; HELCOM
1990; Nehring and Matthaus 1991).
In nearshore areas, long-term series of nutrient levels are rare. A
comparatively early series of nutrient measurements from a nearshore
area is available for the station Boknis Eck in the western Kiel Bight from
1958-1975, followed by single data up till 1984 (Babenerd and Zeitzschel
1985; Babenerd 1986). While total P did not change during the period
1958-1975 (mean value 1.09 flmol dm -3), in the following years till 1984
the mean value of 1.94 flmol dm- 3 was significantly higher. Mean phosphate values did increase from 0.7 to 1.1 flmol dm -3 between 1958 and
1969, and remained stable. Dissolved inorganic nitrogen data from the
same station, available from 1965-1985, showed little variation and no
trend (von Bodungen 1986).