

88
I. De Vries et al.
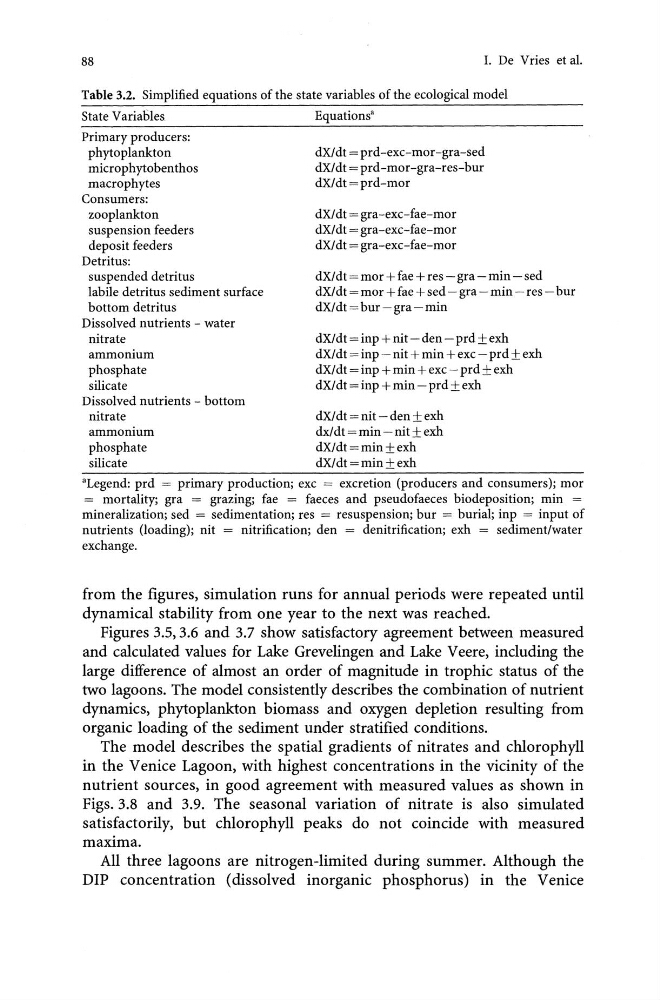
Table 3.2. Simplified equations of the state variables of the ecological model
State Variables
Primary producers:
phytoplankton
microphytobenthos
macrophytes
Consumers:
zooplankton
suspension feeders
deposit feeders
Detritus:
suspended detritus
labile detritus sediment surface
bottom detritus
Dissolved nutrients - water
nitrate
ammonium
phosphate
silicate
Dissolved nutrients - bottom
nitrate
ammonium
phosphate
silicate
Equations"
dX/dt = prd-exc-mor-gra-sed
dX/dt = prd-mor-gra-res-bur
dX/dt = prd-mor
dX/dt = gra-exc-fae-mor
dX/dt = gra-exc-fae-mor
dX/dt = gra-exc-fae-mor
dX/dt = mor + fae + res - gra - min - sed
dXldt = mor + fae + sed - gra - min - res - bur
dX/dt=bur-gra-min
dX/dt = inp + nit - den - prd ± exh
dX/dt = inp - nit + min + exc - prd ± exh
dX/dt = inp + min + exc - prd ± exh
dXldt = inp + min - prd ± exh
dXldt = nit - den ± exh
dx! dt = min - nit ± exh
dXldt = min ± exh
dX/dt = min ± exh
"Legend: prd = primary production; exc = excretion (producers and consumers); mor
= mortality; gra = grazing; fae = faeces and pseudo faeces biodeposition; min =
mineralization; sed = sedimentation; res = resuspension; bur = burial; inp = input of
nutrients (loading); nit = nitrification; den = denitrification; exh = sediment/water
exchange.
from the figures, simulation runs for annual periods were repeated until
dynamical stability from one year to the next was reached.
Figures 3.5,3.6 and 3.7 show satisfactory agreement between measured
and calculated values for Lake Grevelingen and Lake Veere, including the
large difference of almost an order of magnitude in trophic status of the
two lagoons. The model consistently describes the combination of nutrient
dynamics, phytoplankton biomass and oxygen depletion resulting from
organic loading of the sediment under stratified conditions.
The model describes the spatial gradients of nitrates and chlorophyll
in the Venice Lagoon, with highest concentrations in the vicinity of the
nutrient sources, in good agreement with measured values as shown in
Figs. 3.8 and 3.9. The seasonal variation of nitrate is also simulated
satisfactorily, but chlorophyll peaks do not coincide with measured
maxima.
All three lagoons are nitrogen-limited during summer. Although the
DIP concentration (dissolved inorganic phosphorus) in the Venice
I. De Vries et al.
Table 3.2. Simplified equations of the state variables of the ecological model
State Variables
Primary producers:
phytoplankton
microphytobenthos
macrophytes
Consumers:
zooplankton
suspension feeders
deposit feeders
Detritus:
suspended detritus
labile detritus sediment surface
bottom detritus
Dissolved nutrients - water
nitrate
ammonium
phosphate
silicate
Dissolved nutrients - bottom
nitrate
ammonium
phosphate
silicate
Equations"
dX/dt = prd-exc-mor-gra-sed
dX/dt = prd-mor-gra-res-bur
dX/dt = prd-mor
dX/dt = gra-exc-fae-mor
dX/dt = gra-exc-fae-mor
dX/dt = gra-exc-fae-mor
dX/dt = mor + fae + res - gra - min - sed
dXldt = mor + fae + sed - gra - min - res - bur
dX/dt=bur-gra-min
dX/dt = inp + nit - den - prd ± exh
dX/dt = inp - nit + min + exc - prd ± exh
dX/dt = inp + min + exc - prd ± exh
dXldt = inp + min - prd ± exh
dXldt = nit - den ± exh
dx! dt = min - nit ± exh
dXldt = min ± exh
dX/dt = min ± exh
"Legend: prd = primary production; exc = excretion (producers and consumers); mor
= mortality; gra = grazing; fae = faeces and pseudo faeces biodeposition; min =
mineralization; sed = sedimentation; res = resuspension; bur = burial; inp = input of
nutrients (loading); nit = nitrification; den = denitrification; exh = sediment/water
exchange.
from the figures, simulation runs for annual periods were repeated until
dynamical stability from one year to the next was reached.
Figures 3.5,3.6 and 3.7 show satisfactory agreement between measured
and calculated values for Lake Grevelingen and Lake Veere, including the
large difference of almost an order of magnitude in trophic status of the
two lagoons. The model consistently describes the combination of nutrient
dynamics, phytoplankton biomass and oxygen depletion resulting from
organic loading of the sediment under stratified conditions.
The model describes the spatial gradients of nitrates and chlorophyll
in the Venice Lagoon, with highest concentrations in the vicinity of the
nutrient sources, in good agreement with measured values as shown in
Figs. 3.8 and 3.9. The seasonal variation of nitrate is also simulated
satisfactorily, but chlorophyll peaks do not coincide with measured
maxima.
All three lagoons are nitrogen-limited during summer. Although the
DIP concentration (dissolved inorganic phosphorus) in the Venice