

Wigglesworthia brevipalpis, Xanthomonas axonopodis,
X. campestris, Xylella fastidiosa, Yersinia pestis, and
Y. pestis KIM CO_92) shows only two cases of inconsistency between gene and organism phylogenies (Lerat et al.
2003). This suggests that in these gammaproteobacteria,
homologous gene replacement of ancestral genes is rare,
despite their very different lifestyles. Analyses of nucleotide
compositions and codon usage patterns revealed a very low
HGT rate in the spirochete Borrelia burgdorferi (the agent of
Lyme disease), the alphaproteobacterium Rickettsia
prowazekii (the etiologic agent of epidemic typhus), and
the firmicute Mycoplasma genitalium (responsible for
infections of the genital and respiratory tracts) (Ochman
et al. 2000). Finally, a phylogenetic analysis of 297 genes
present in 40 prokaryotes only shows 33 HGT cases (11 %)
(Ge et al. 2005).
Studies aiming at quantifying HGT rates in prokaryotes are
numerous but failed to reach a consensus. Indeed, the main
conclusion of these studies is that the HGT rates vary from
one study to another. This suggests that HGT rates vary
among lineages, maybe due to different capacities to catch
exogenous DNA. For instance, some species are not naturally
transformable. HGT rate variations may also reflect variations
in the effectiveness of the restriction and recombination
systems. External factors, such as the persistence of DNA in
the environment, microbial diversity of the ecosystems, and
selective pressures, may also affect HGT rates. More surprisingly, HGT rate estimations vary according to the methods
used to detect the HGT events. For example, a detailed
analysis of the E. coli and S. enterica genomes reveals that a
large number of E. coli genes with normal nucleotide composition have no apparent orthologues in S. typhi, and conversely, many E. coli genes of atypical composition have
orthologues in S. typhi. The former group of genes would
have been detected as the result of HGT by methods based on
taxonomic distribution but not by methods based on nucleotide composition. In contrast, the latter group of genes would
have been detected as the result of HGT by methods based on
nucleotide composition but not by methods based on taxonomic distribution. Finally, phylogenetic methods show that a
number of putative HGT events detected by their atypical
base composition and biased codon usage are in fact native
genes, and conversely, some genes previously classified as
native appeared to be the result of HGT (Koski et al. 2001).
This illustrates that HGT rate estimations are impacted by the
methods used irrespectively of the organisms under study. It
was proposed that the use of different methods of HGT
detection could help to overcome these methodological
biases. Indeed, if the approaches used to detect HGT are
reliable, we expect that HGT events detected by different
approaches represent real HGT, whereas those detected by
only one method represent false positives. However, most
published studies are based on the use of a single method.
These observations have led some researchers to compare
the reliability and effectiveness of different approaches for
HGT detection. To do so, they have measured the rate
of false positives (i.e., genes detected as the result of
HGT whereas they are in fact native) and false negatives
(i.e., genes detected as native whereas they have been transferred). Among them, the study performed by Ragan in 2001
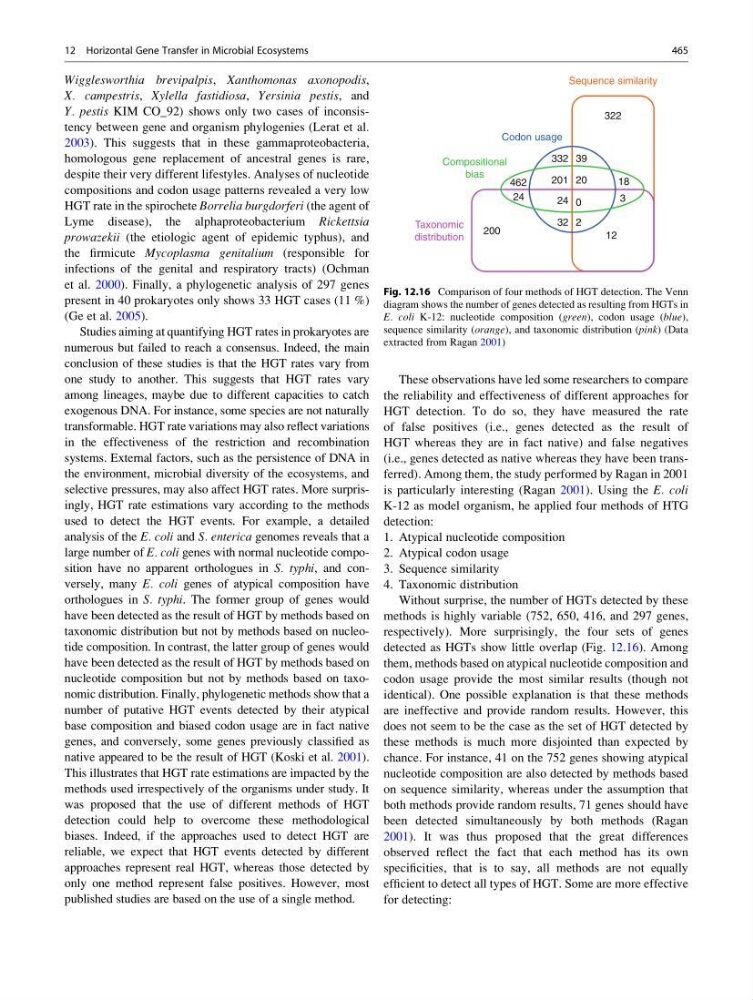
is particularly interesting (Ragan 2001). Using the E. coli
K-12 as model organism, he applied four methods of HTG
detection:
1. Atypical nucleotide composition
2. Atypical codon usage
3. Sequence similarity
4. Taxonomic distribution
Without surprise, the number of HGTs detected by these
methods is highly variable (752, 650, 416, and 297 genes,
respectively). More surprisingly, the four sets of genes
detected as HGTs show little overlap (Fig. 12.16). Among
them, methods based on atypical nucleotide composition and
codon usage provide the most similar results (though not
identical). One possible explanation is that these methods
are ineffective and provide random results. However, this
does not seem to be the case as the set of HGT detected by
these methods is much more disjointed than expected by
chance. For instance, 41 on the 752 genes showing atypical
nucleotide composition are also detected by methods based
on sequence similarity, whereas under the assumption that
both methods provide random results, 71 genes should have
been detected simultaneously by both methods (Ragan
2001). It was thus proposed that the great differences
observed reflect the fact that each method has its own
specificities, that is to say, all methods are not equally
efficient to detect all types of HGT. Some are more effective
for detecting:
462
Compositional
bias
Codon usage
332
Sequence similarity
Taxonomic
distribution
322
200
0
20
24
3
2
201
18
24
39
32
12
Fig. 12.16 Comparison of four methods of HGT detection. The Venn
diagram shows the number of genes detected as resulting from HGTs in
E. coli K-12: nucleotide composition (green), codon usage (blue),
sequence similarity (orange), and taxonomic distribution (pink) (Data
extracted from Ragan 2001)
12 Horizontal Gene Transfer in Microbial Ecosystems
465
X. campestris, Xylella fastidiosa, Yersinia pestis, and
Y. pestis KIM CO_92) shows only two cases of inconsistency between gene and organism phylogenies (Lerat et al.
2003). This suggests that in these gammaproteobacteria,
homologous gene replacement of ancestral genes is rare,
despite their very different lifestyles. Analyses of nucleotide
compositions and codon usage patterns revealed a very low
HGT rate in the spirochete Borrelia burgdorferi (the agent of
Lyme disease), the alphaproteobacterium Rickettsia
prowazekii (the etiologic agent of epidemic typhus), and
the firmicute Mycoplasma genitalium (responsible for
infections of the genital and respiratory tracts) (Ochman
et al. 2000). Finally, a phylogenetic analysis of 297 genes
present in 40 prokaryotes only shows 33 HGT cases (11 %)
(Ge et al. 2005).
Studies aiming at quantifying HGT rates in prokaryotes are
numerous but failed to reach a consensus. Indeed, the main
conclusion of these studies is that the HGT rates vary from
one study to another. This suggests that HGT rates vary
among lineages, maybe due to different capacities to catch
exogenous DNA. For instance, some species are not naturally
transformable. HGT rate variations may also reflect variations
in the effectiveness of the restriction and recombination
systems. External factors, such as the persistence of DNA in
the environment, microbial diversity of the ecosystems, and
selective pressures, may also affect HGT rates. More surprisingly, HGT rate estimations vary according to the methods
used to detect the HGT events. For example, a detailed
analysis of the E. coli and S. enterica genomes reveals that a
large number of E. coli genes with normal nucleotide composition have no apparent orthologues in S. typhi, and conversely, many E. coli genes of atypical composition have
orthologues in S. typhi. The former group of genes would
have been detected as the result of HGT by methods based on
taxonomic distribution but not by methods based on nucleotide composition. In contrast, the latter group of genes would
have been detected as the result of HGT by methods based on
nucleotide composition but not by methods based on taxonomic distribution. Finally, phylogenetic methods show that a
number of putative HGT events detected by their atypical
base composition and biased codon usage are in fact native
genes, and conversely, some genes previously classified as
native appeared to be the result of HGT (Koski et al. 2001).
This illustrates that HGT rate estimations are impacted by the
methods used irrespectively of the organisms under study. It
was proposed that the use of different methods of HGT
detection could help to overcome these methodological
biases. Indeed, if the approaches used to detect HGT are
reliable, we expect that HGT events detected by different
approaches represent real HGT, whereas those detected by
only one method represent false positives. However, most
published studies are based on the use of a single method.
These observations have led some researchers to compare
the reliability and effectiveness of different approaches for
HGT detection. To do so, they have measured the rate
of false positives (i.e., genes detected as the result of
HGT whereas they are in fact native) and false negatives
(i.e., genes detected as native whereas they have been transferred). Among them, the study performed by Ragan in 2001
is particularly interesting (Ragan 2001). Using the E. coli
K-12 as model organism, he applied four methods of HTG
detection:
1. Atypical nucleotide composition
2. Atypical codon usage
3. Sequence similarity
4. Taxonomic distribution
Without surprise, the number of HGTs detected by these
methods is highly variable (752, 650, 416, and 297 genes,
respectively). More surprisingly, the four sets of genes
detected as HGTs show little overlap (Fig. 12.16). Among
them, methods based on atypical nucleotide composition and
codon usage provide the most similar results (though not
identical). One possible explanation is that these methods
are ineffective and provide random results. However, this
does not seem to be the case as the set of HGT detected by
these methods is much more disjointed than expected by
chance. For instance, 41 on the 752 genes showing atypical
nucleotide composition are also detected by methods based
on sequence similarity, whereas under the assumption that
both methods provide random results, 71 genes should have
been detected simultaneously by both methods (Ragan
2001). It was thus proposed that the great differences
observed reflect the fact that each method has its own
specificities, that is to say, all methods are not equally
efficient to detect all types of HGT. Some are more effective
for detecting:
462
Compositional
bias
Codon usage
332
Sequence similarity
Taxonomic
distribution
322
200
0
20
24
3
2
201
18
24
39
32
12
Fig. 12.16 Comparison of four methods of HGT detection. The Venn
diagram shows the number of genes detected as resulting from HGTs in
E. coli K-12: nucleotide composition (green), codon usage (blue),
sequence similarity (orange), and taxonomic distribution (pink) (Data
extracted from Ragan 2001)
12 Horizontal Gene Transfer in Microbial Ecosystems
465