

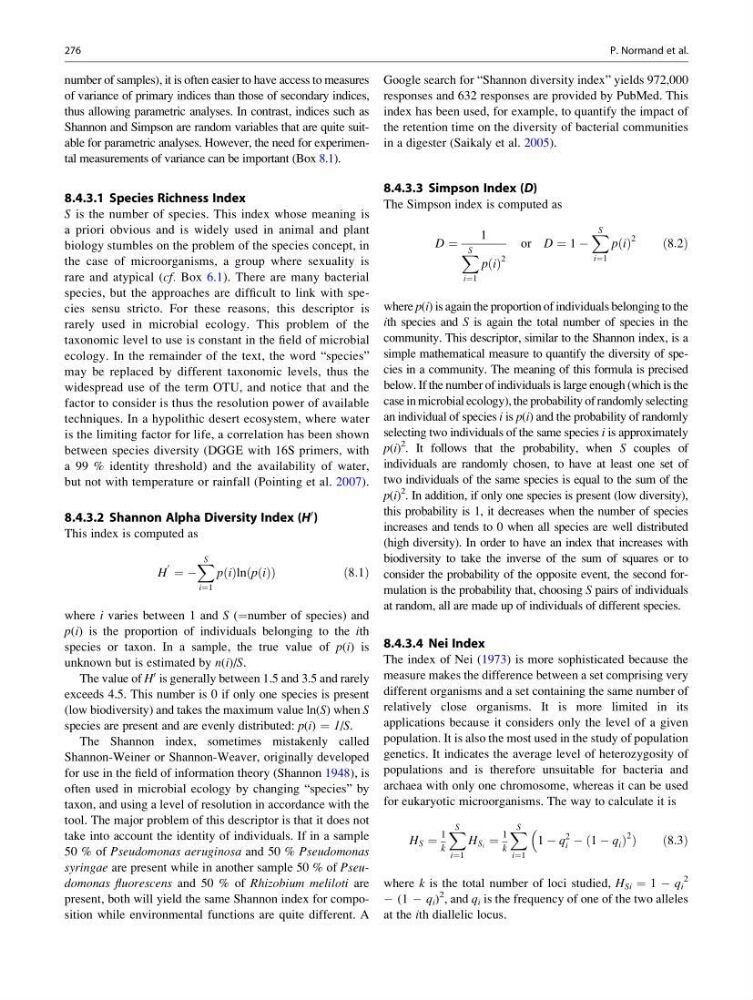
number of samples), it is often easier to have access to measures
of variance of primary indices than those of secondary indices,
thus allowing parametric analyses. In contrast, indices such as
Shannon and Simpson are random variables that are quite suitable for parametric analyses. However, the need for experimental measurements of variance can be important (Box 8.1).
8.4.3.1 Species Richness Index
S is the number of species. This index whose meaning is
a priori obvious and is widely used in animal and plant
biology stumbles on the problem of the species concept, in
the case of microorganisms, a group where sexuality is
rare and atypical (cf. Box 6.1). There are many bacterial
species, but the approaches are difficult to link with species sensu stricto. For these reasons, this descriptor is
rarely used in microbial ecology. This problem of the
taxonomic level to use is constant in the field of microbial
ecology. In the remainder of the text, the word “species”
may be replaced by different taxonomic levels, thus the
widespread use of the term OTU, and notice that and the
factor to consider is thus the resolution power of available
techniques. In a hypolithic desert ecosystem, where water
is the limiting factor for life, a correlation has been shown
between species diversity (DGGE with 16S primers, with
a 99 % identity threshold) and the availability of water,
but not with temperature or rainfall (Pointing et al. 2007).
8.4.3.2 Shannon Alpha Diversity Index (H
0 )
This index is computed as
H
0 ¼ À
X S
i¼1
p i
ð Þln p i
ð Þ
ð
Þ
ð8:1Þ
where i varies between 1 and S (¼number of species) and
p(i) is the proportion of individuals belonging to the ith
species or taxon. In a sample, the true value of p(i) is
unknown but is estimated by n(i)/S.
The value of H
0 is generally between 1.5 and 3.5 and rarely
exceeds 4.5. This number is 0 if only one species is present
(low biodiversity) and takes the maximum value ln(S) when S
species are present and are evenly distributed: p(i) ¼ 1/S.
The Shannon index, sometimes mistakenly called
Shannon-Weiner or Shannon-Weaver, originally developed
for use in the field of information theory (Shannon 1948), is
often used in microbial ecology by changing “species” by
taxon, and using a level of resolution in accordance with the
tool. The major problem of this descriptor is that it does not
take into account the identity of individuals. If in a sample
50 % of Pseudomonas aeruginosa and 50 % Pseudomonas
syringae are present while in another sample 50 % of Pseudomonas fluorescens and 50 % of Rhizobium meliloti are
present, both will yield the same Shannon index for composition while environmental functions are quite different. A
Google search for “Shannon diversity index” yields 972,000
responses and 632 responses are provided by PubMed. This
index has been used, for example, to quantify the impact of
the retention time on the diversity of bacterial communities
in a digester (Saikaly et al. 2005).
8.4.3.3 Simpson Index (D)
The Simpson index is computed as
D ¼
1
X S
i¼1
p i
ð Þ
2
or D ¼ 1 À
X S
i¼1
p i
ð Þ
2
ð8:2Þ
where p(i) is again the proportion of individuals belonging to the
ith species and S is again the total number of species in the
community. This descriptor, similar to the Shannon index, is a
simple mathematical measure to quantify the diversity of species in a community. The meaning of this formula is precised
below. If the number of individuals is large enough (which is the
case in microbial ecology), the probability of randomly selecting
an individual of species i is p(i) and the probability of randomly
selecting two individuals of the same species i is approximately
p(i)
2
. It follows that the probability, when S couples of
individuals are randomly chosen, to have at least one set of
two individuals of the same species is equal to the sum of the
p(i)
2
. In addition, if only one species is present (low diversity),
this probability is 1, it decreases when the number of species
increases and tends to 0 when all species are well distributed
(high diversity). In order to have an index that increases with
biodiversity to take the inverse of the sum of squares or to
consider the probability of the opposite event, the second formulation is the probability that, choosing S pairs of individuals
at random, all are made up of individuals of different species.
8.4.3.4 Nei Index
The index of Nei (1973) is more sophisticated because the
measure makes the difference between a set comprising very
different organisms and a set containing the same number of
relatively close organisms. It is more limited in its
applications because it considers only the level of a given
population. It is also the most used in the study of population
genetics. It indicates the average level of heterozygosity of
populations and is therefore unsuitable for bacteria and
archaea with only one chromosome, whereas it can be used
for eukaryotic microorganisms. The way to calculate it is
H S ¼
1
k
X S
i¼1
H S i ¼
1
k
X S
i¼1
1 À q
2
i À 1 À q i
ð
Þ
2 Þ
ð8:3Þ
where k is the total number of loci studied, H Si ¼ 1 À q i
2
À (1 À q i )
2 , and q i is the frequency of one of the two alleles
at the ith diallelic locus.
276
P. Normand et al.
of variance of primary indices than those of secondary indices,
thus allowing parametric analyses. In contrast, indices such as
Shannon and Simpson are random variables that are quite suitable for parametric analyses. However, the need for experimental measurements of variance can be important (Box 8.1).
8.4.3.1 Species Richness Index
S is the number of species. This index whose meaning is
a priori obvious and is widely used in animal and plant
biology stumbles on the problem of the species concept, in
the case of microorganisms, a group where sexuality is
rare and atypical (cf. Box 6.1). There are many bacterial
species, but the approaches are difficult to link with species sensu stricto. For these reasons, this descriptor is
rarely used in microbial ecology. This problem of the
taxonomic level to use is constant in the field of microbial
ecology. In the remainder of the text, the word “species”
may be replaced by different taxonomic levels, thus the
widespread use of the term OTU, and notice that and the
factor to consider is thus the resolution power of available
techniques. In a hypolithic desert ecosystem, where water
is the limiting factor for life, a correlation has been shown
between species diversity (DGGE with 16S primers, with
a 99 % identity threshold) and the availability of water,
but not with temperature or rainfall (Pointing et al. 2007).
8.4.3.2 Shannon Alpha Diversity Index (H
0 )
This index is computed as
H
0 ¼ À
X S
i¼1
p i
ð Þln p i
ð Þ
ð
Þ
ð8:1Þ
where i varies between 1 and S (¼number of species) and
p(i) is the proportion of individuals belonging to the ith
species or taxon. In a sample, the true value of p(i) is
unknown but is estimated by n(i)/S.
The value of H
0 is generally between 1.5 and 3.5 and rarely
exceeds 4.5. This number is 0 if only one species is present
(low biodiversity) and takes the maximum value ln(S) when S
species are present and are evenly distributed: p(i) ¼ 1/S.
The Shannon index, sometimes mistakenly called
Shannon-Weiner or Shannon-Weaver, originally developed
for use in the field of information theory (Shannon 1948), is
often used in microbial ecology by changing “species” by
taxon, and using a level of resolution in accordance with the
tool. The major problem of this descriptor is that it does not
take into account the identity of individuals. If in a sample
50 % of Pseudomonas aeruginosa and 50 % Pseudomonas
syringae are present while in another sample 50 % of Pseudomonas fluorescens and 50 % of Rhizobium meliloti are
present, both will yield the same Shannon index for composition while environmental functions are quite different. A
Google search for “Shannon diversity index” yields 972,000
responses and 632 responses are provided by PubMed. This
index has been used, for example, to quantify the impact of
the retention time on the diversity of bacterial communities
in a digester (Saikaly et al. 2005).
8.4.3.3 Simpson Index (D)
The Simpson index is computed as
D ¼
1
X S
i¼1
p i
ð Þ
2
or D ¼ 1 À
X S
i¼1
p i
ð Þ
2
ð8:2Þ
where p(i) is again the proportion of individuals belonging to the
ith species and S is again the total number of species in the
community. This descriptor, similar to the Shannon index, is a
simple mathematical measure to quantify the diversity of species in a community. The meaning of this formula is precised
below. If the number of individuals is large enough (which is the
case in microbial ecology), the probability of randomly selecting
an individual of species i is p(i) and the probability of randomly
selecting two individuals of the same species i is approximately
p(i)
2
. It follows that the probability, when S couples of
individuals are randomly chosen, to have at least one set of
two individuals of the same species is equal to the sum of the
p(i)
2
. In addition, if only one species is present (low diversity),
this probability is 1, it decreases when the number of species
increases and tends to 0 when all species are well distributed
(high diversity). In order to have an index that increases with
biodiversity to take the inverse of the sum of squares or to
consider the probability of the opposite event, the second formulation is the probability that, choosing S pairs of individuals
at random, all are made up of individuals of different species.
8.4.3.4 Nei Index
The index of Nei (1973) is more sophisticated because the
measure makes the difference between a set comprising very
different organisms and a set containing the same number of
relatively close organisms. It is more limited in its
applications because it considers only the level of a given
population. It is also the most used in the study of population
genetics. It indicates the average level of heterozygosity of
populations and is therefore unsuitable for bacteria and
archaea with only one chromosome, whereas it can be used
for eukaryotic microorganisms. The way to calculate it is
H S ¼
1
k
X S
i¼1
H S i ¼
1
k
X S
i¼1
1 À q
2
i À 1 À q i
ð
Þ
2 Þ
ð8:3Þ
where k is the total number of loci studied, H Si ¼ 1 À q i
2
À (1 À q i )
2 , and q i is the frequency of one of the two alleles
at the ith diallelic locus.
276
P. Normand et al.