

Therefore, formulating hypotheses in studies of microbial
biodiversity is by necessity, more dramatically so than in
other fields of biology, a dialectical process between ideal
objectives and strong experimental and analytical
constraints.
8.3.1 Approaches Based on Diversity Indices
To formulate hypotheses about the structure and composition of microbial communities, it is useful to examine the
statistical tests available. A variety of parametric and nonparametric statistical tests have been developed and used
(Morris et al. 2002). These tests are based on calculations
of indices (single variables summarizing information on the
original multivariable data) that integrate different diversity
parameters. Unfortunately, for “cultural” reasons,
microbiologists do not always have sufficient expertise in
statistics to know all the available tests and their limitations.
There are two major differences between parametric and
nonparametric analyses, which can have a significant impact
on the formulation of hypotheses and the way the study is
conducted. Firstly, parametric tests generally require diversity measures for variables with normal distribution. Several
diversity indices, including the Shannon, are inherently randomly distributed (i.e., they are random variables). In the
absence of data on this point, a preliminary measure should
be used to verify this. Given the sampling and technical
constraints for characterizing microbial diversity, it is not
surprising that this step is generally neglected if it cannot be
done by mathematical simulations. In contrast, nonparametric tests can be used with data that are not randomly
distributed. In addition, nonparametric tests can be used
with a large number of quantitative as well as qualitative
biodiversity measures, while parametric tests require more
formal measures of diversity. Many examples of how statistical tests were coupled to different indices for quantification
of diversity have been described by Morris and collaborators
(2002).
8.3.2 Multivariate Approaches
The accumulation of microbial diversity data and information on related environmental parameters not only permit to
better define patterns of diversity but also to better understand what are the spatial and temporal parameters that
explain these patterns.
These complex microbial ecology issues often lead to
data sets that are very difficult to exploit by conventional
statistical tests. These difficulties can be solved by using
multivariate statistical analyses. These methods of analysis
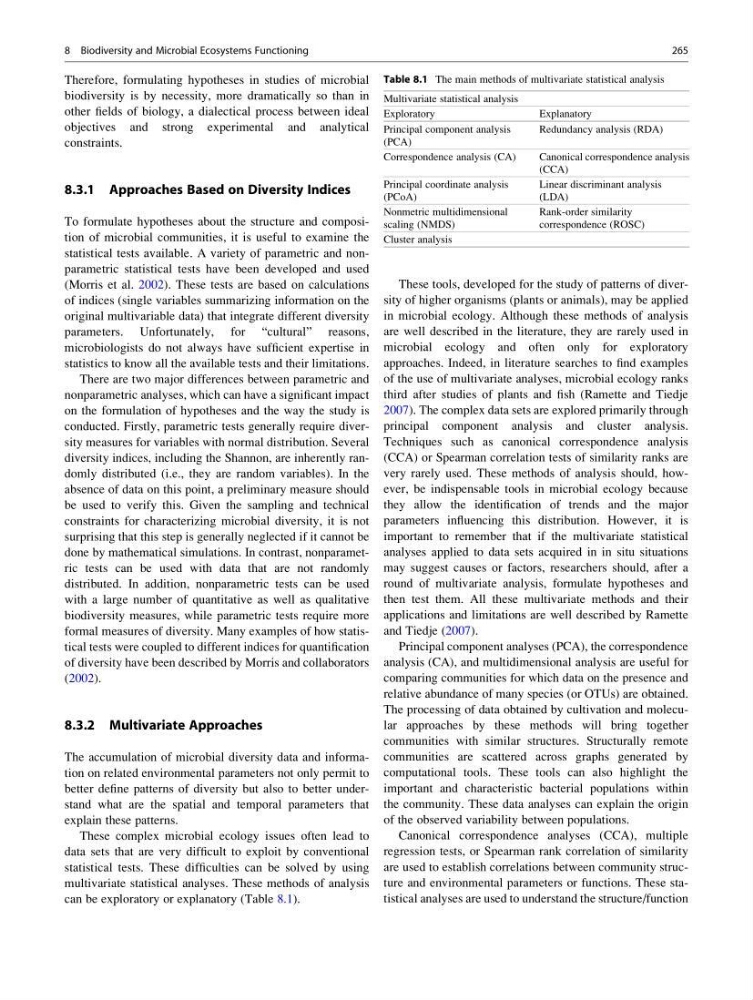
can be exploratory or explanatory (Table 8.1).
These tools, developed for the study of patterns of diversity of higher organisms (plants or animals), may be applied
in microbial ecology. Although these methods of analysis
are well described in the literature, they are rarely used in
microbial ecology and often only for exploratory
approaches. Indeed, in literature searches to find examples
of the use of multivariate analyses, microbial ecology ranks
third after studies of plants and fish (Ramette and Tiedje
2007). The complex data sets are explored primarily through
principal component analysis and cluster analysis.
Techniques such as canonical correspondence analysis
(CCA) or Spearman correlation tests of similarity ranks are
very rarely used. These methods of analysis should, however, be indispensable tools in microbial ecology because
they allow the identification of trends and the major
parameters influencing this distribution. However, it is
important to remember that if the multivariate statistical
analyses applied to data sets acquired in in situ situations
may suggest causes or factors, researchers should, after a
round of multivariate analysis, formulate hypotheses and
then test them. All these multivariate methods and their
applications and limitations are well described by Ramette
and Tiedje (2007).
Principal component analyses (PCA), the correspondence
analysis (CA), and multidimensional analysis are useful for
comparing communities for which data on the presence and
relative abundance of many species (or OTUs) are obtained.
The processing of data obtained by cultivation and molecular approaches by these methods will bring together
communities with similar structures. Structurally remote
communities are scattered across graphs generated by
computational tools. These tools can also highlight the
important and characteristic bacterial populations within
the community. These data analyses can explain the origin
of the observed variability between populations.
Canonical correspondence analyses (CCA), multiple
regression tests, or Spearman rank correlation of similarity
are used to establish correlations between community structure and environmental parameters or functions. These statistical analyses are used to understand the structure/function
Table 8.1 The main methods of multivariate statistical analysis
Multivariate statistical analysis
Exploratory
Explanatory
Principal component analysis
(PCA)
Redundancy analysis (RDA)
Correspondence analysis (CA)
Canonical correspondence analysis
(CCA)
Principal coordinate analysis
(PCoA)
Linear discriminant analysis
(LDA)
Nonmetric multidimensional
scaling (NMDS)
Rank-order similarity
correspondence (ROSC)
Cluster analysis
8 Biodiversity and Microbial Ecosystems Functioning
265
biodiversity is by necessity, more dramatically so than in
other fields of biology, a dialectical process between ideal
objectives and strong experimental and analytical
constraints.
8.3.1 Approaches Based on Diversity Indices
To formulate hypotheses about the structure and composition of microbial communities, it is useful to examine the
statistical tests available. A variety of parametric and nonparametric statistical tests have been developed and used
(Morris et al. 2002). These tests are based on calculations
of indices (single variables summarizing information on the
original multivariable data) that integrate different diversity
parameters. Unfortunately, for “cultural” reasons,
microbiologists do not always have sufficient expertise in
statistics to know all the available tests and their limitations.
There are two major differences between parametric and
nonparametric analyses, which can have a significant impact
on the formulation of hypotheses and the way the study is
conducted. Firstly, parametric tests generally require diversity measures for variables with normal distribution. Several
diversity indices, including the Shannon, are inherently randomly distributed (i.e., they are random variables). In the
absence of data on this point, a preliminary measure should
be used to verify this. Given the sampling and technical
constraints for characterizing microbial diversity, it is not
surprising that this step is generally neglected if it cannot be
done by mathematical simulations. In contrast, nonparametric tests can be used with data that are not randomly
distributed. In addition, nonparametric tests can be used
with a large number of quantitative as well as qualitative
biodiversity measures, while parametric tests require more
formal measures of diversity. Many examples of how statistical tests were coupled to different indices for quantification
of diversity have been described by Morris and collaborators
(2002).
8.3.2 Multivariate Approaches
The accumulation of microbial diversity data and information on related environmental parameters not only permit to
better define patterns of diversity but also to better understand what are the spatial and temporal parameters that
explain these patterns.
These complex microbial ecology issues often lead to
data sets that are very difficult to exploit by conventional
statistical tests. These difficulties can be solved by using
multivariate statistical analyses. These methods of analysis
can be exploratory or explanatory (Table 8.1).
These tools, developed for the study of patterns of diversity of higher organisms (plants or animals), may be applied
in microbial ecology. Although these methods of analysis
are well described in the literature, they are rarely used in
microbial ecology and often only for exploratory
approaches. Indeed, in literature searches to find examples
of the use of multivariate analyses, microbial ecology ranks
third after studies of plants and fish (Ramette and Tiedje
2007). The complex data sets are explored primarily through
principal component analysis and cluster analysis.
Techniques such as canonical correspondence analysis
(CCA) or Spearman correlation tests of similarity ranks are
very rarely used. These methods of analysis should, however, be indispensable tools in microbial ecology because
they allow the identification of trends and the major
parameters influencing this distribution. However, it is
important to remember that if the multivariate statistical
analyses applied to data sets acquired in in situ situations
may suggest causes or factors, researchers should, after a
round of multivariate analysis, formulate hypotheses and
then test them. All these multivariate methods and their
applications and limitations are well described by Ramette
and Tiedje (2007).
Principal component analyses (PCA), the correspondence
analysis (CA), and multidimensional analysis are useful for
comparing communities for which data on the presence and
relative abundance of many species (or OTUs) are obtained.
The processing of data obtained by cultivation and molecular approaches by these methods will bring together
communities with similar structures. Structurally remote
communities are scattered across graphs generated by
computational tools. These tools can also highlight the
important and characteristic bacterial populations within
the community. These data analyses can explain the origin
of the observed variability between populations.
Canonical correspondence analyses (CCA), multiple
regression tests, or Spearman rank correlation of similarity
are used to establish correlations between community structure and environmental parameters or functions. These statistical analyses are used to understand the structure/function
Table 8.1 The main methods of multivariate statistical analysis
Multivariate statistical analysis
Exploratory
Explanatory
Principal component analysis
(PCA)
Redundancy analysis (RDA)
Correspondence analysis (CA)
Canonical correspondence analysis
(CCA)
Principal coordinate analysis
(PCoA)
Linear discriminant analysis
(LDA)
Nonmetric multidimensional
scaling (NMDS)
Rank-order similarity
correspondence (ROSC)
Cluster analysis
8 Biodiversity and Microbial Ecosystems Functioning
265