

both supporting the stratigraphy and constraining the
sea-level rise to around 121 ka. To confirm these results
however requires replicating the back-stepping reef stratigraphy and obtaining a reliable chronology in other
stable areas.
Origin of meltwater pulses
The preceding review of individual claims of meltwater
pulses shows that solid geological evidence exists only
for the 3 jumps in sea level during the last deglaciation
at 14.6, 11.4 and 8 ka. Preliminary evidence also exists
for a jump at the end of the last Interglaciation around
121 ka, although this requires support from other stable
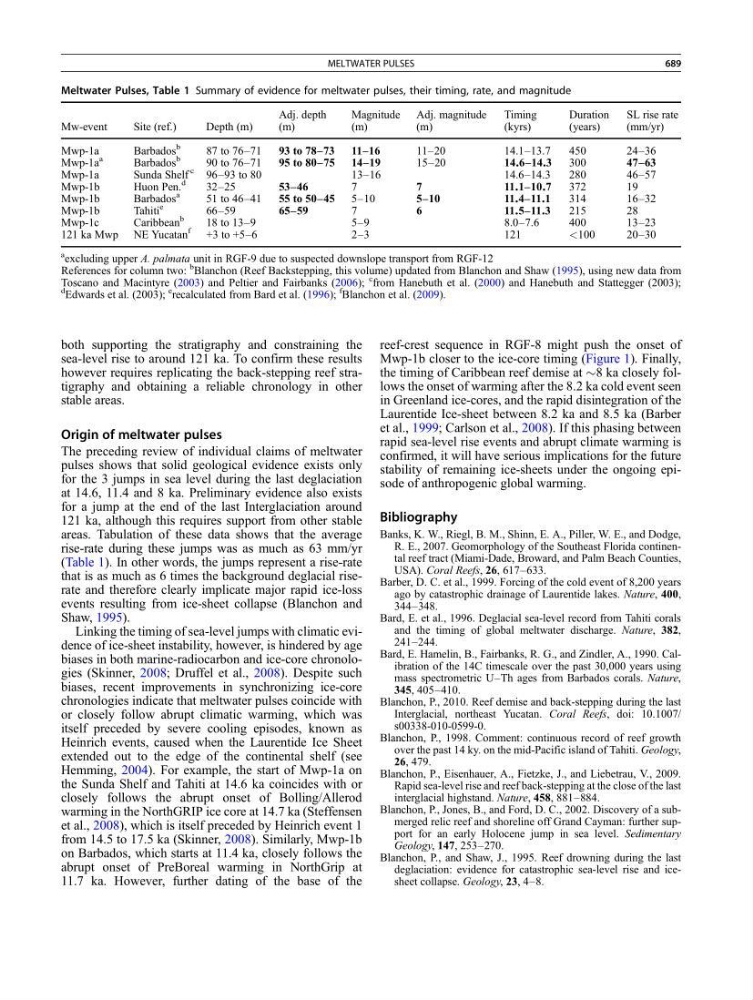
areas. Tabulation of these data shows that the average
rise-rate during these jumps was as much as 63 mm/yr
(Table 1). In other words, the jumps represent a rise-rate
that is as much as 6 times the background deglacial riserate and therefore clearly implicate major rapid ice-loss
events resulting from ice-sheet collapse (Blanchon and
Shaw, 1995).
Linking the timing of sea-level jumps with climatic evidence of ice-sheet instability, however, is hindered by age
biases in both marine-radiocarbon and ice-core chronologies (Skinner, 2008; Druffel et al., 2008). Despite such
biases, recent improvements in synchronizing ice-core
chronologies indicate that meltwater pulses coincide with
or closely follow abrupt climatic warming, which was
itself preceded by severe cooling episodes, known as
Heinrich events, caused when the Laurentide Ice Sheet
extended out to the edge of the continental shelf (see
Hemming, 2004). For example, the start of Mwp-1a on
the Sunda Shelf and Tahiti at 14.6 ka coincides with or
closely follows the abrupt onset of Bolling/Allerod
warming in the NorthGRIP ice core at 14.7 ka (Steffensen
et al., 2008), which is itself preceded by Heinrich event 1
from 14.5 to 17.5 ka (Skinner, 2008). Similarly, Mwp-1b
on Barbados, which starts at 11.4 ka, closely follows the
abrupt onset of PreBoreal warming in NorthGrip at
11.7 ka. However, further dating of the base of the
reef-crest sequence in RGF-8 might push the onset of
Mwp-1b closer to the ice-core timing (Figure 1). Finally,
the timing of Caribbean reef demise at $8 ka closely follows the onset of warming after the 8.2 ka cold event seen
in Greenland ice-cores, and the rapid disintegration of the
Laurentide Ice-sheet between 8.2 ka and 8.5 ka (Barber
et al., 1999; Carlson et al., 2008). If this phasing between
rapid sea-level rise events and abrupt climate warming is
confirmed, it will have serious implications for the future
stability of remaining ice-sheets under the ongoing episode of anthropogenic global warming.
Bibliography
Banks, K. W., Riegl, B. M., Shinn, E. A., Piller, W. E., and Dodge,
R. E., 2007. Geomorphology of the Southeast Florida continental reef tract (Miami-Dade, Broward, and Palm Beach Counties,
USA). Coral Reefs, 26, 617–633.
Barber, D. C. et al., 1999. Forcing of the cold event of 8,200 years
ago by catastrophic drainage of Laurentide lakes. Nature, 400,
344–348.
Bard, E. et al., 1996. Deglacial sea-level record from Tahiti corals
and the timing of global meltwater discharge. Nature, 382,
241–244.
Bard, E. Hamelin, B., Fairbanks, R. G., and Zindler, A., 1990. Calibration of the 14C timescale over the past 30,000 years using
mass spectrometric U–Th ages from Barbados corals. Nature,
345, 405–410.
Blanchon, P., 2010. Reef demise and back-stepping during the last
Interglacial, northeast Yucatan. Coral Reefs, doi: 10.1007/
s00338-010-0599-0.
Blanchon, P., 1998. Comment: continuous record of reef growth
over the past 14 ky. on the mid-Pacific island of Tahiti. Geology,
26, 479.
Blanchon, P., Eisenhauer, A., Fietzke, J., and Liebetrau, V., 2009.
Rapid sea-level rise and reef back-stepping at the close of the last
interglacial highstand. Nature, 458, 881–884.
Blanchon, P., Jones, B., and Ford, D. C., 2002. Discovery of a submerged relic reef and shoreline off Grand Cayman: further support for an early Holocene jump in sea level. Sedimentary
Geology, 147, 253–270.
Blanchon, P., and Shaw, J., 1995. Reef drowning during the last
deglaciation: evidence for catastrophic sea-level rise and icesheet collapse. Geology, 23, 4–8.
Meltwater Pulses, Table 1 Summary of evidence for meltwater pulses, their timing, rate, and magnitude
Mw-event
Site (ref.)
Depth (m)
Adj. depth
(m)
Magnitude
(m)
Adj. magnitude
(m)
Timing
(kyrs)
Duration
(years)
SL rise rate
(mm/yr)
Mwp-1a
Barbados
b
87 to 76–71
93 to 78–73 11–16
11–20
14.1–13.7
450
24–36
Mwp-1a
a
Barbados
b
90 to 76–71
95 to 80–75 14–19
15–20
14.6–14.3
300
47–63
Mwp-1a
Sunda Shelf
c
96–93 to 80
13–16
14.6–14.3
280
46–57
Mwp-1b
Huon Pen.
d
32–25
53–46
7
7
11.1–10.7
372
19
Mwp-1b
Barbados
a
51 to 46–41
55 to 50–45 5–10
5–10
11.4–11.1
314
16–32
Mwp-1b
Tahiti
e
66–59
65–59
7
6
11.5–11.3
215
28
Mwp-1c
Caribbean
b
18 to 13–9
5 –9
8.0–7.6
400
13–23
121 ka Mwp NE Yucatan
f
+3 to +5–6
2 –3
121
<100
20–30
a excluding upper A. palmata unit in RGF-9 due to suspected downslope transport from RGF-12
References for column two:
b Blanchon (Reef Backstepping, this volume) updated from Blanchon and Shaw (1995), using new data from
Toscano and Macintyre (2003) and Peltier and Fairbanks (2006);
c from Hanebuth et al. (2000) and Hanebuth and Stattegger (2003);
d
Edwards et al. (2003);
e recalculated from Bard et al. (1996);
f Blanchon et al. (2009).
MELTWATER PULSES
689