

number of coral species
18°
C
18° C
18
°C
18°C
18°C
18°C
1 8 °C
0–100
201–300
101–200
301–400 401–500 501–600
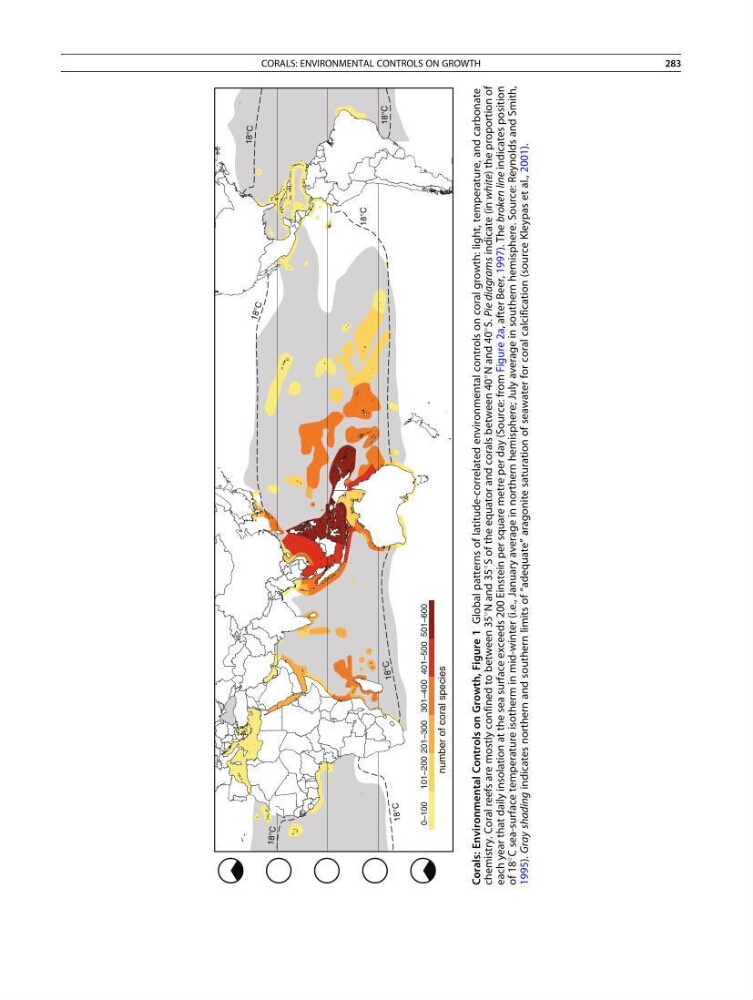
Corals: Environmental Controls on Growth, Figure 1
Global patterns of latitude-correlated environmental controls on coral growth: light, temperature, and carbonate
chemistry. Coral reefs are mostly confined to between 35
N and 35
S of the equator and corals between 40
N and 40
S. Pie diagrams
indicate (in white)
the proportion of
each year that daily insolation at the sea surface exceeds 200 Einstein per square metre per day (Source: from Figure 2a, after Beer, 1997). The broken line
indicates position
of 18
C sea-surface temperature isotherm in mid-winter (i.e., January average in northern hemisphere; July average in southern hemisphere. Source: Reynolds and Smith,
1995). Gray shading
indicates northern and southern limits of “adequate” aragonite saturation of seawater for coral calcification (source Kleypas et al., 2001).
CORALS: ENVIRONMENTAL CONTROLS ON GROWTH
283
18°
C
18° C
18
°C
18°C
18°C
18°C
1 8 °C
0–100
201–300
101–200
301–400 401–500 501–600
Corals: Environmental Controls on Growth, Figure 1
Global patterns of latitude-correlated environmental controls on coral growth: light, temperature, and carbonate
chemistry. Coral reefs are mostly confined to between 35
N and 35
S of the equator and corals between 40
N and 40
S. Pie diagrams
indicate (in white)
the proportion of
each year that daily insolation at the sea surface exceeds 200 Einstein per square metre per day (Source: from Figure 2a, after Beer, 1997). The broken line
indicates position
of 18
C sea-surface temperature isotherm in mid-winter (i.e., January average in northern hemisphere; July average in southern hemisphere. Source: Reynolds and Smith,
1995). Gray shading
indicates northern and southern limits of “adequate” aragonite saturation of seawater for coral calcification (source Kleypas et al., 2001).
CORALS: ENVIRONMENTAL CONTROLS ON GROWTH
283