

(Langdon et al., 2003). In practice, flux of oxygen is used
instead of carbon dioxide to estimate net photosynthesis
and respiration, assuming photosynthetic and respiratory
quotients of 1.0 (range 0.8–1.2). Many such measurements have produced a uniform “metabolic standard” for
reefs (Table 2).
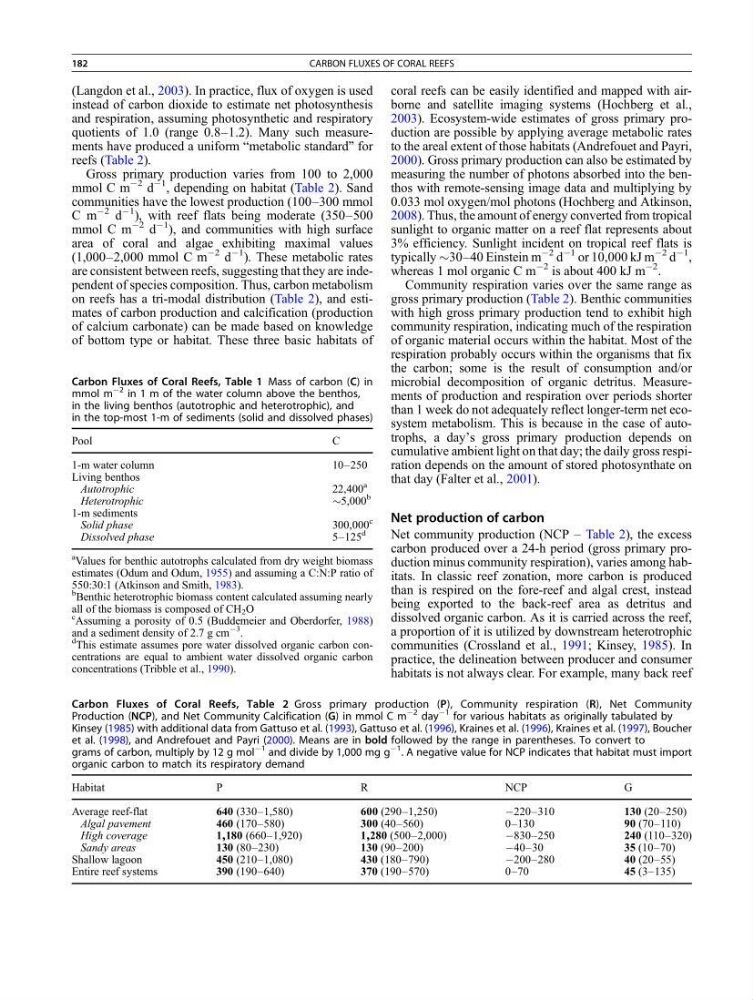
Gross primary production varies from 100 to 2,000
mmol C m
À2 d
À1
, depending on habitat (Table 2). Sand
communities have the lowest production (100–300 mmol
C m
À2 d
À1
), with reef flats being moderate (350–500
mmol C m
À2 d
À1
), and communities with high surface
area of coral and algae exhibiting maximal values
(1,000–2,000 mmol C m
À2 d
À1
). These metabolic rates
are consistent between reefs, suggesting that they are independent of species composition. Thus, carbon metabolism
on reefs has a tri-modal distribution (Table 2), and estimates of carbon production and calcification (production
of calcium carbonate) can be made based on knowledge
of bottom type or habitat. These three basic habitats of
coral reefs can be easily identified and mapped with airborne and satellite imaging systems (Hochberg et al.,
2003). Ecosystem-wide estimates of gross primary production are possible by applying average metabolic rates
to the areal extent of those habitats (Andrefouet and Payri,
2000). Gross primary production can also be estimated by
measuring the number of photons absorbed into the benthos with remote-sensing image data and multiplying by
0.033 mol oxygen/mol photons (Hochberg and Atkinson,
2008). Thus, the amount of energy converted from tropical
sunlight to organic matter on a reef flat represents about
3% efficiency. Sunlight incident on tropical reef flats is
typically $30–40 Einstein m
À2 d
À1 or 10,000 kJ m
À2 d
À1
,
whereas 1 mol organic C m
À2 is about 400 kJ m
À2 .
Community respiration varies over the same range as
gross primary production (Table 2). Benthic communities
with high gross primary production tend to exhibit high
community respiration, indicating much of the respiration
of organic material occurs within the habitat. Most of the
respiration probably occurs within the organisms that fix
the carbon; some is the result of consumption and/or
microbial decomposition of organic detritus. Measurements of production and respiration over periods shorter
than 1 week do not adequately reflect longer-term net ecosystem metabolism. This is because in the case of autotrophs, a day’s gross primary production depends on
cumulative ambient light on that day; the daily gross respiration depends on the amount of stored photosynthate on
that day (Falter et al., 2001).
Net production of carbon
Net community production (NCP – Table 2), the excess
carbon produced over a 24-h period (gross primary production minus community respiration), varies among habitats. In classic reef zonation, more carbon is produced
than is respired on the fore-reef and algal crest, instead
being exported to the back-reef area as detritus and
dissolved organic carbon. As it is carried across the reef,
a proportion of it is utilized by downstream heterotrophic
communities (Crossland et al., 1991; Kinsey, 1985). In
practice, the delineation between producer and consumer
habitats is not always clear. For example, many back reef
Carbon Fluxes of Coral Reefs, Table 2 Gross primary production (P), Community respiration (R), Net Community
Production (NCP), and Net Community Calcification (G) in mmol C m
À2 day
À1 for various habitats as originally tabulated by
Kinsey (1985) with additional data from Gattuso et al. (1993), Gattuso et al. (1996), Kraines et al. (1996), Kraines et al. (1997), Boucher
et al. (1998), and Andrefouet and Payri (2000). Means are in bold followed by the range in parentheses. To convert to
grams of carbon, multiply by 12 g mol
À1 and divide by 1,000 mg g
À1 . A negative value for NCP indicates that habitat must import
organic carbon to match its respiratory demand
Habitat
P
R
NCP
G
Average reef-flat
640 (330–1,580)
600 (290–1,250)
À220–310
130 (20–250)
Algal pavement
460 (170–580)
300 (40–560)
0–130
90 (70–110)
High coverage
1,180 (660–1,920)
1,280 (500–2,000)
À830–250
240 (110–320)
Sandy areas
130 (80–230)
130 (90–200)
À40–30
35 (10–70)
Shallow lagoon
450 (210–1,080)
430 (180–790)
À200–280
40 (20–55)
Entire reef systems
390 (190–640)
370 (190–570)
0–70
45 (3–135)
Carbon Fluxes of Coral Reefs, Table 1 Mass of carbon (C) in
mmol m
À2 in 1 m of the water column above the benthos,
in the living benthos (autotrophic and heterotrophic), and
in the top-most 1-m of sediments (solid and dissolved phases)
Pool
C
1-m water column
10–250
Living benthos
Autotrophic
22,400
a
Heterotrophic
$5,000
b
1-m sediments
Solid phase
300,000
c
Dissolved phase
5–125
d
a Values for benthic autotrophs calculated from dry weight biomass
estimates (Odum and Odum, 1955) and assuming a C:N:P ratio of
550:30:1 (Atkinson and Smith, 1983).
b
Benthic heterotrophic biomass content calculated assuming nearly
all of the biomass is composed of CH 2 O
c Assuming a porosity of 0.5 (Buddemeier and Oberdorfer, 1988)
and a sediment density of 2.7 g cm
À3
.
d
This estimate assumes pore water dissolved organic carbon concentrations are equal to ambient water dissolved organic carbon
concentrations (Tribble et al., 1990).
182
CARBON FLUXES OF CORAL REEFS
instead of carbon dioxide to estimate net photosynthesis
and respiration, assuming photosynthetic and respiratory
quotients of 1.0 (range 0.8–1.2). Many such measurements have produced a uniform “metabolic standard” for
reefs (Table 2).
Gross primary production varies from 100 to 2,000
mmol C m
À2 d
À1
, depending on habitat (Table 2). Sand
communities have the lowest production (100–300 mmol
C m
À2 d
À1
), with reef flats being moderate (350–500
mmol C m
À2 d
À1
), and communities with high surface
area of coral and algae exhibiting maximal values
(1,000–2,000 mmol C m
À2 d
À1
). These metabolic rates
are consistent between reefs, suggesting that they are independent of species composition. Thus, carbon metabolism
on reefs has a tri-modal distribution (Table 2), and estimates of carbon production and calcification (production
of calcium carbonate) can be made based on knowledge
of bottom type or habitat. These three basic habitats of
coral reefs can be easily identified and mapped with airborne and satellite imaging systems (Hochberg et al.,
2003). Ecosystem-wide estimates of gross primary production are possible by applying average metabolic rates
to the areal extent of those habitats (Andrefouet and Payri,
2000). Gross primary production can also be estimated by
measuring the number of photons absorbed into the benthos with remote-sensing image data and multiplying by
0.033 mol oxygen/mol photons (Hochberg and Atkinson,
2008). Thus, the amount of energy converted from tropical
sunlight to organic matter on a reef flat represents about
3% efficiency. Sunlight incident on tropical reef flats is
typically $30–40 Einstein m
À2 d
À1 or 10,000 kJ m
À2 d
À1
,
whereas 1 mol organic C m
À2 is about 400 kJ m
À2 .
Community respiration varies over the same range as
gross primary production (Table 2). Benthic communities
with high gross primary production tend to exhibit high
community respiration, indicating much of the respiration
of organic material occurs within the habitat. Most of the
respiration probably occurs within the organisms that fix
the carbon; some is the result of consumption and/or
microbial decomposition of organic detritus. Measurements of production and respiration over periods shorter
than 1 week do not adequately reflect longer-term net ecosystem metabolism. This is because in the case of autotrophs, a day’s gross primary production depends on
cumulative ambient light on that day; the daily gross respiration depends on the amount of stored photosynthate on
that day (Falter et al., 2001).
Net production of carbon
Net community production (NCP – Table 2), the excess
carbon produced over a 24-h period (gross primary production minus community respiration), varies among habitats. In classic reef zonation, more carbon is produced
than is respired on the fore-reef and algal crest, instead
being exported to the back-reef area as detritus and
dissolved organic carbon. As it is carried across the reef,
a proportion of it is utilized by downstream heterotrophic
communities (Crossland et al., 1991; Kinsey, 1985). In
practice, the delineation between producer and consumer
habitats is not always clear. For example, many back reef
Carbon Fluxes of Coral Reefs, Table 2 Gross primary production (P), Community respiration (R), Net Community
Production (NCP), and Net Community Calcification (G) in mmol C m
À2 day
À1 for various habitats as originally tabulated by
Kinsey (1985) with additional data from Gattuso et al. (1993), Gattuso et al. (1996), Kraines et al. (1996), Kraines et al. (1997), Boucher
et al. (1998), and Andrefouet and Payri (2000). Means are in bold followed by the range in parentheses. To convert to
grams of carbon, multiply by 12 g mol
À1 and divide by 1,000 mg g
À1 . A negative value for NCP indicates that habitat must import
organic carbon to match its respiratory demand
Habitat
P
R
NCP
G
Average reef-flat
640 (330–1,580)
600 (290–1,250)
À220–310
130 (20–250)
Algal pavement
460 (170–580)
300 (40–560)
0–130
90 (70–110)
High coverage
1,180 (660–1,920)
1,280 (500–2,000)
À830–250
240 (110–320)
Sandy areas
130 (80–230)
130 (90–200)
À40–30
35 (10–70)
Shallow lagoon
450 (210–1,080)
430 (180–790)
À200–280
40 (20–55)
Entire reef systems
390 (190–640)
370 (190–570)
0–70
45 (3–135)
Carbon Fluxes of Coral Reefs, Table 1 Mass of carbon (C) in
mmol m
À2 in 1 m of the water column above the benthos,
in the living benthos (autotrophic and heterotrophic), and
in the top-most 1-m of sediments (solid and dissolved phases)
Pool
C
1-m water column
10–250
Living benthos
Autotrophic
22,400
a
Heterotrophic
$5,000
b
1-m sediments
Solid phase
300,000
c
Dissolved phase
5–125
d
a Values for benthic autotrophs calculated from dry weight biomass
estimates (Odum and Odum, 1955) and assuming a C:N:P ratio of
550:30:1 (Atkinson and Smith, 1983).
b
Benthic heterotrophic biomass content calculated assuming nearly
all of the biomass is composed of CH 2 O
c Assuming a porosity of 0.5 (Buddemeier and Oberdorfer, 1988)
and a sediment density of 2.7 g cm
À3
.
d
This estimate assumes pore water dissolved organic carbon concentrations are equal to ambient water dissolved organic carbon
concentrations (Tribble et al., 1990).
182
CARBON FLUXES OF CORAL REEFS