

Arabian Sea Upwelling
51
guished by showing them as a broken line on the charts. Likewise, a broken line was used
to indicate occasions when unsuitable gain settings were used and records were doubtful,
and all parts of the track covered during the hours of darkness when the fish shoals
migrated to the surface and became unidentifiable from the dense scattering and reverberation in the surface layers. These distribution charts have been deposited in the FAO
Fisheries Data Center.
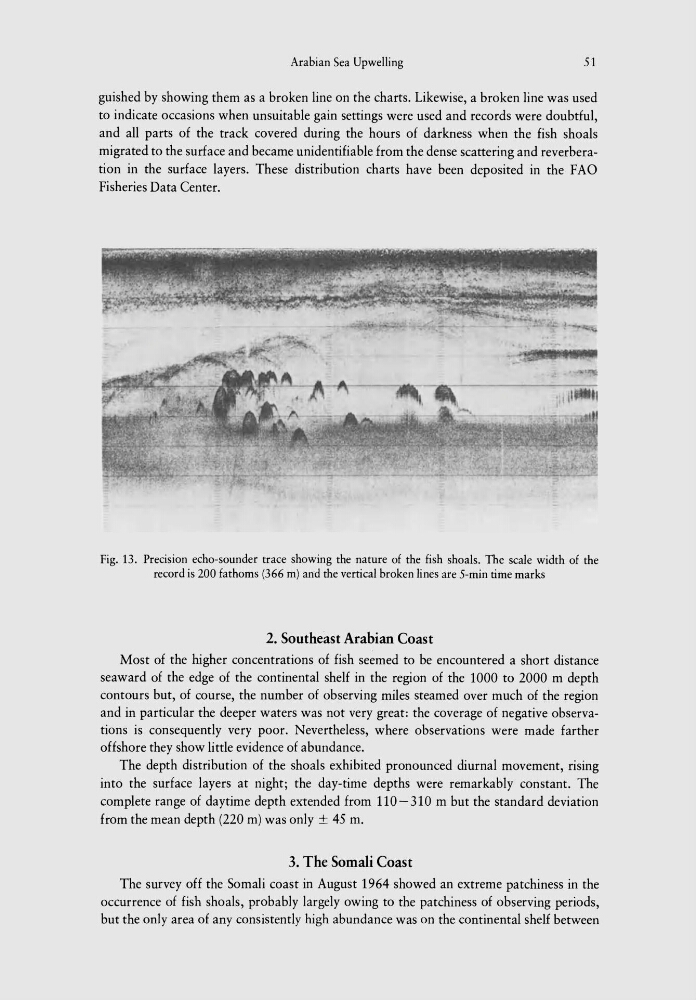
Fig. 13. Precision echo-sounder trace showing the nature of the fish shoals. The scale width of the
record is 200 fathoms (366 m) and the vertical broken Jines are 5-min time marks
2. Southeast Arabian Coast
Most of the higher concentrations of fish seemed to be encountered a short distance
seaward of the edge of the continental shelf in the region of the 1000 to 2000 m depth
contours but, of course, the number of observing miles steamed over much of the region
and in particular the deeper waters was not very great: the coverage of negative observations is consequently very poor. Nevertheless, where observations were made farther
offshore they show little evidence of abundance.
The depth distribution of the shoals exhibited pronounced diurnal movement, rising
into the surface layers at night; the day-time depths were remarkably constant. The
complete range of daytime depth extended from 110 - 310 m but the standard deviation
from the mean depth (220 m) was only ± 45 m.
3. The Somali Coast
The survey off the Somali coast in August 1964 showed an extreme patchiness in the
occurrence of fish shoals, probably largely owing to the patchiness of observing periods,
but the only area of any consistently high abundance was on the continental shelf between
51
guished by showing them as a broken line on the charts. Likewise, a broken line was used
to indicate occasions when unsuitable gain settings were used and records were doubtful,
and all parts of the track covered during the hours of darkness when the fish shoals
migrated to the surface and became unidentifiable from the dense scattering and reverberation in the surface layers. These distribution charts have been deposited in the FAO
Fisheries Data Center.
Fig. 13. Precision echo-sounder trace showing the nature of the fish shoals. The scale width of the
record is 200 fathoms (366 m) and the vertical broken Jines are 5-min time marks
2. Southeast Arabian Coast
Most of the higher concentrations of fish seemed to be encountered a short distance
seaward of the edge of the continental shelf in the region of the 1000 to 2000 m depth
contours but, of course, the number of observing miles steamed over much of the region
and in particular the deeper waters was not very great: the coverage of negative observations is consequently very poor. Nevertheless, where observations were made farther
offshore they show little evidence of abundance.
The depth distribution of the shoals exhibited pronounced diurnal movement, rising
into the surface layers at night; the day-time depths were remarkably constant. The
complete range of daytime depth extended from 110 - 310 m but the standard deviation
from the mean depth (220 m) was only ± 45 m.
3. The Somali Coast
The survey off the Somali coast in August 1964 showed an extreme patchiness in the
occurrence of fish shoals, probably largely owing to the patchiness of observing periods,
but the only area of any consistently high abundance was on the continental shelf between