

508
D. ]. TRANTER:
plankton and productivity (Table 6 b). This is the natural consequence of the functional
relation between the two in the absence of rapid recycling induced by over-grazing.
As we have already seen (Table 7), the general trend in this zone is for zooplankton and
phytoplankton to fluctuate out of phase with each other; as a consequence, phytoplankton
and productivity values separated in time by 3 -4 weeks (Table 8) show a weaker (serial)
correlation than do concurrent pairs of values.
4. Zooplankton Hervivores and Zooplankton Carnivores
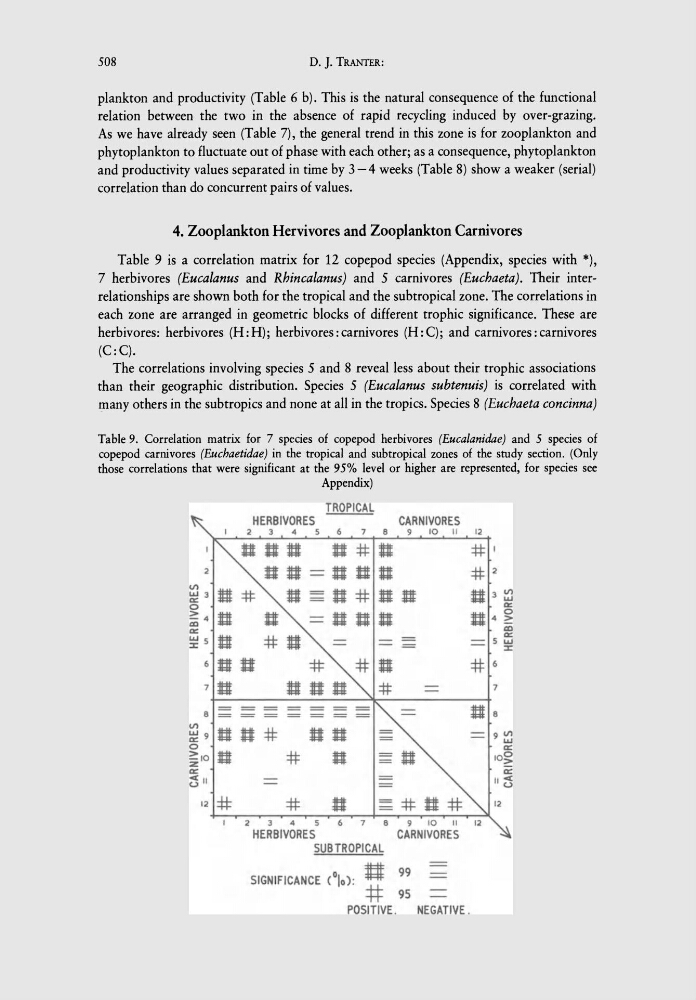
Table 9 is a correlation matrix for 12 copepod species (Appendix, species with *),
7 herbivores (Eucalanus and Rhincalanus) and 5 carnivores (Euchaeta). Their interrelationships are shown both for the tropical and the subtropical zone. The correlations in
each zone are arranged in geometric blocks of different trophic significance. These are
herbivores: herbivores (H: H); herbivores: carnivores (H: C); and carnivores: carnivores
(C:C).
The correlations involving species 5 and 8 reveal less about their trophic associations
than their geographic distribution. Species 5 (Eucalanus subtenuis) is correlated with
many others in the subtropics and none at all in the tropics. Species 8 (Euchaeta concinna)
Table 9. Correlation matrix for 7 species of copepod herbivores (Eucalanidae) and 5 species of
copepod carnivores (Euchaetidae) in the tropical and subtropical zones of the study section. (Only
those correlations that were significant at the 95% level or higher are represented, for species see
12 *
Appendix)
TROPICAL
HERBIVORES
CARNIVORES
3
4
5
6
7
8
9
10 II
12
-fi
2 3 4 5 6 7 8
9
10
II
HERBIVORES
CARNIVORES
SUB TROPICAL
SIGNIFICANCE (010) : ! 99
-tt- 9S
POSITIVE.
NEGATIVE .
#6
7
U8
9 V1
.... a:::
10~
a:
II ~
D. ]. TRANTER:
plankton and productivity (Table 6 b). This is the natural consequence of the functional
relation between the two in the absence of rapid recycling induced by over-grazing.
As we have already seen (Table 7), the general trend in this zone is for zooplankton and
phytoplankton to fluctuate out of phase with each other; as a consequence, phytoplankton
and productivity values separated in time by 3 -4 weeks (Table 8) show a weaker (serial)
correlation than do concurrent pairs of values.
4. Zooplankton Hervivores and Zooplankton Carnivores
Table 9 is a correlation matrix for 12 copepod species (Appendix, species with *),
7 herbivores (Eucalanus and Rhincalanus) and 5 carnivores (Euchaeta). Their interrelationships are shown both for the tropical and the subtropical zone. The correlations in
each zone are arranged in geometric blocks of different trophic significance. These are
herbivores: herbivores (H: H); herbivores: carnivores (H: C); and carnivores: carnivores
(C:C).
The correlations involving species 5 and 8 reveal less about their trophic associations
than their geographic distribution. Species 5 (Eucalanus subtenuis) is correlated with
many others in the subtropics and none at all in the tropics. Species 8 (Euchaeta concinna)
Table 9. Correlation matrix for 7 species of copepod herbivores (Eucalanidae) and 5 species of
copepod carnivores (Euchaetidae) in the tropical and subtropical zones of the study section. (Only
those correlations that were significant at the 95% level or higher are represented, for species see
12 *
Appendix)
TROPICAL
HERBIVORES
CARNIVORES
3
4
5
6
7
8
9
10 II
12
-fi
2 3 4 5 6 7 8
9
10
II
HERBIVORES
CARNIVORES
SUB TROPICAL
SIGNIFICANCE (010) : ! 99
-tt- 9S
POSITIVE.
NEGATIVE .
#6
7
U8
9 V1
.... a:::
10~
a:
II ~