

6. Transfer of Organic Matter in Different Trophic Levels
6.1
Production in the Indian Ocean and the Transfer
from the Primary to the Secondary Level
D. H. CUSHING
During the Indian Ocean Expedition many measurements of primary production were
made with the 14 C technique and many hauls with nets from about 200 m were taken.
One of the objects of the expeditions was to estimate primary and secondary production
and the transfer coefficients, and to obtain a measure of tertiary production.
I. Methods
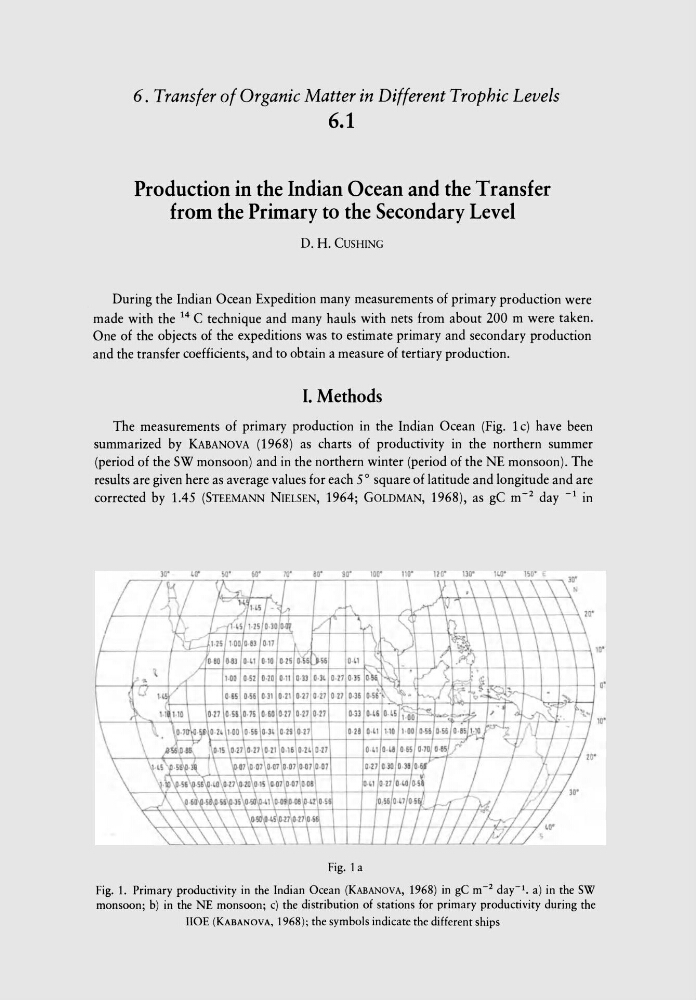
The measurements of primary production in the Indian Ocean (Fig. 1 c) have been
summarized by KABANOVA (1968) as charts of productivity in the northern summer
(period of the SW monsoon) and in the northern winter (period of the NE monsoon). The
results are given here as average values for each 5° square of latitude and longitude and are
corrected by 1.45 (STEEMANN NIELSEN, 1964; GOLDMAN, 1968), as gC m- 2 day -1 in
~--+---.I--'>=:-If--+--+-f--+--h-*-+--II- +--ffi--'!,,?-1r- -t--#'f--'
Fig. 1. Primary productivity in the Indian Ocean (KABANOVA, 1968) in gC m- 2 day-1. a) in the SW
monsoon; b) in the NE monsoon; c) the distribution of stations for primary productivity during the
HOE (KABANOVA, 1968); the symbols indicate the different ships
6.1
Production in the Indian Ocean and the Transfer
from the Primary to the Secondary Level
D. H. CUSHING
During the Indian Ocean Expedition many measurements of primary production were
made with the 14 C technique and many hauls with nets from about 200 m were taken.
One of the objects of the expeditions was to estimate primary and secondary production
and the transfer coefficients, and to obtain a measure of tertiary production.
I. Methods
The measurements of primary production in the Indian Ocean (Fig. 1 c) have been
summarized by KABANOVA (1968) as charts of productivity in the northern summer
(period of the SW monsoon) and in the northern winter (period of the NE monsoon). The
results are given here as average values for each 5° square of latitude and longitude and are
corrected by 1.45 (STEEMANN NIELSEN, 1964; GOLDMAN, 1968), as gC m- 2 day -1 in
~--+---.I--'>=:-If--+--+-f--+--h-*-+--II- +--ffi--'!,,?-1r- -t--#'f--'
Fig. 1. Primary productivity in the Indian Ocean (KABANOVA, 1968) in gC m- 2 day-1. a) in the SW
monsoon; b) in the NE monsoon; c) the distribution of stations for primary productivity during the
HOE (KABANOVA, 1968); the symbols indicate the different ships