

Tuna Fisheries and their Resources in the Indian Ocean
441
oceans are calculated as follows: 29, 174, and 217 tons per 1000 km 2 for the Indian,
the Pacific and the Atlantic Oceans respectively. These statistics suggest that tuna stocks
in the Indian Ocean are fairly highly utilized, though other fisheries are still underdeveloped.
Fig. 3 (a - e) gives average amounts of catch in weight of tuna species and 4 largesized tuna species combined, per 1 000 longline hooks, by unit area (10 latitudinal by
20 longitudinal degrees) and on a yearly basis. The values employed here indicate the
efficiency of each species in unit fishing effort. For the 4 large-sized species combined
(Fig. 3 a), the areas of high productivity in the longline fishery are widely dispersed over
the entire Ocean, though more frequently observed in the western part of the Ocean.
10
~
0
10
I
Alb.
~
I/)
0
c
0 10
...,
'0 - -
~
B.E.
~
$? 0
. ~ 10
£.
U
- 0
830
20
~
~
10 four species combined
°1stO. 2ndO. 3rdO. 4thO.
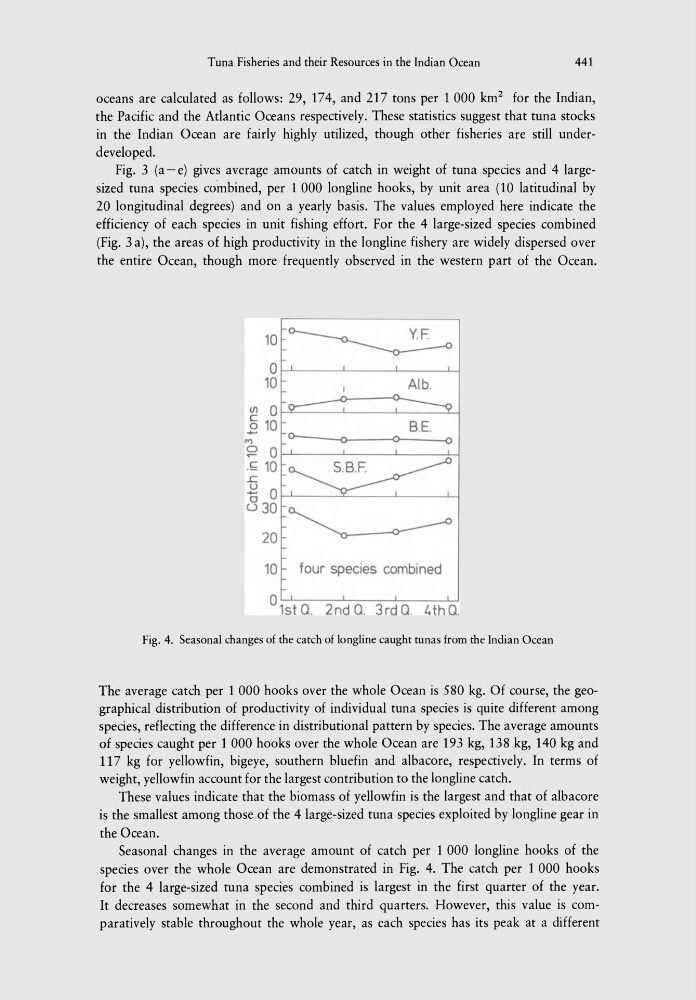
Fig. 4. Seasonal changes of the catch of longline caught tunas from the Indian Ocean
The average catch per 1 000 hooks over the whole Ocean is 580 kg. Of course, the geographical distribution of productivity of individual tuna species is quite different among
species, reflecting the difference in distributional pattern by species. The average amounts
of species caught per 1 000 hooks over the whole Ocean are 193 kg, 138 kg, 140 kg and
117 kg for yellowfin, bigeye, southern bluefin and albacore, respectively. In terms of
weight, yellowfin account for the largest contribution to the longJine catch.
These values indicate that the biomass of yellowfin is the largest and that of albacore
is the smallest among those of the 4 large-sized tuna species exploited by longline gear in
the Ocean.
Seasonal changes in the average amount of catch per 1 000 longline hooks of the
species over the whole Ocean are demonstrated in Fig. 4. The catch per 1 000 hooks
for the 4 large-sized tuna species combined is largest in the first quarter of the year.
It decreases somewhat in the second and third quarters. However, this value is comparatively stable throughout the whole year, as each species has its peak at a different
441
oceans are calculated as follows: 29, 174, and 217 tons per 1000 km 2 for the Indian,
the Pacific and the Atlantic Oceans respectively. These statistics suggest that tuna stocks
in the Indian Ocean are fairly highly utilized, though other fisheries are still underdeveloped.
Fig. 3 (a - e) gives average amounts of catch in weight of tuna species and 4 largesized tuna species combined, per 1 000 longline hooks, by unit area (10 latitudinal by
20 longitudinal degrees) and on a yearly basis. The values employed here indicate the
efficiency of each species in unit fishing effort. For the 4 large-sized species combined
(Fig. 3 a), the areas of high productivity in the longline fishery are widely dispersed over
the entire Ocean, though more frequently observed in the western part of the Ocean.
10
~
0
10
I
Alb.
~
I/)
0
c
0 10
...,
'0 - -
~
B.E.
~
$? 0
. ~ 10
£.
U
- 0
830
20
~
~
10 four species combined
°1stO. 2ndO. 3rdO. 4thO.
Fig. 4. Seasonal changes of the catch of longline caught tunas from the Indian Ocean
The average catch per 1 000 hooks over the whole Ocean is 580 kg. Of course, the geographical distribution of productivity of individual tuna species is quite different among
species, reflecting the difference in distributional pattern by species. The average amounts
of species caught per 1 000 hooks over the whole Ocean are 193 kg, 138 kg, 140 kg and
117 kg for yellowfin, bigeye, southern bluefin and albacore, respectively. In terms of
weight, yellowfin account for the largest contribution to the longJine catch.
These values indicate that the biomass of yellowfin is the largest and that of albacore
is the smallest among those of the 4 large-sized tuna species exploited by longline gear in
the Ocean.
Seasonal changes in the average amount of catch per 1 000 longline hooks of the
species over the whole Ocean are demonstrated in Fig. 4. The catch per 1 000 hooks
for the 4 large-sized tuna species combined is largest in the first quarter of the year.
It decreases somewhat in the second and third quarters. However, this value is comparatively stable throughout the whole year, as each species has its peak at a different