

392
M. SAKTHlVEL:
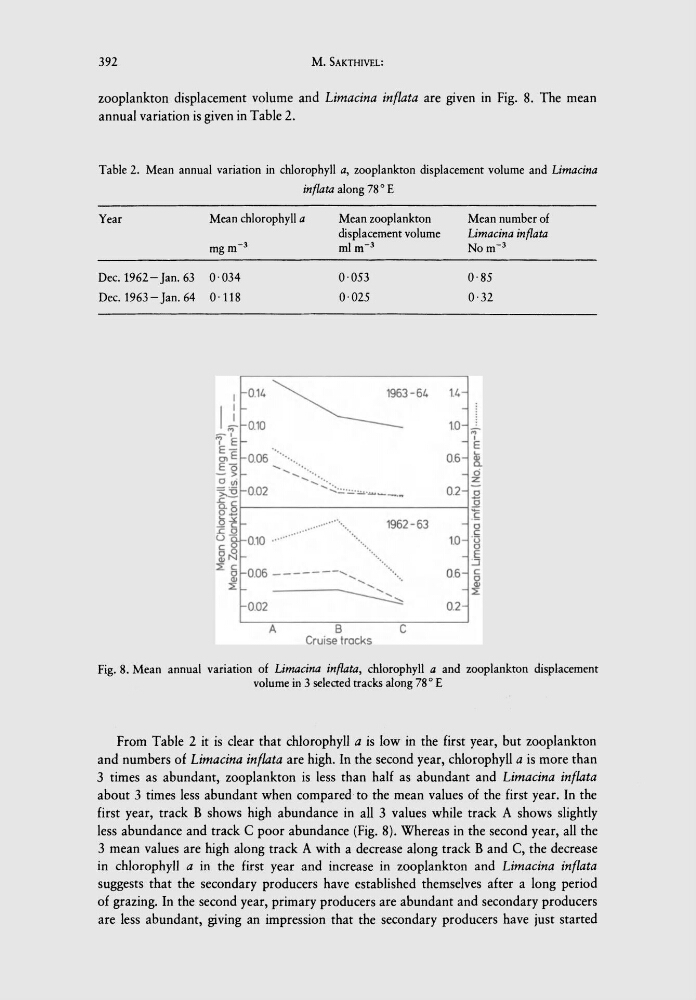
zooplankton displacement volume and Limacina inflata are given in Fig. 8. The mean
annual variation is given in Table 2.
Table 2. Mean annual variation in chlorophyll a, zooplankton displacement volume and Limacina
inflata along 78 0 E
Year
Mean chlorophyll a
Mean zooplankton
Mean number of
displacement volume
Limacina inflata
mgm- 3
mlm- 3
Nom- 3
Dec. 1962 - Jan. 63 0·034
0·053
0·85
Dec. 1963 - Jan. 64 0·118
0·025
0·32
I 0.14
~-"
1.4
11 0.10
1.0
..,
;:;
-.
I
7 E r
E
E- 0.06 ..........
e>E
0.6 ~
Eo
....
- >
.... ........... ::.. ...
d
°vi
z
='6 0.02
..... ".:.:.:.::; . .:.:, . .:.:..:. ........ ---..,.
0.2 ~
£:!0.5 0 ....
~
~~
....
1962-63
.....
0
c
~~ 0.10 .. '
1.0 'u
..
0
~~
E
:::;:c
'.
:.:J
:il 0,06 -------.........
0.6 c
.....
..
:il
:::;:
....
0.Q2~
:::;:
0.2
A
B
C
Cruise tracks
Fig. 8. Mean annual variation of Limacina inflata, chlorophyll a and zooplankton displacement
volume in 3 selected tracks along 78
0
£
From Table 2 it is clear that chlorophyll a is low in the first year, but zooplankton
and numbers of Limacina inflata are high. In the second year, chlorophyll a is more than
3 times as abundant, zooplankton is less than half as abundant and Limacina inflata
about 3 times less abundant when compared to the mean values of the first year. In the
first year, track B shows high abundance in all 3 values while track A shows slightly
less abundance and track C poor abundance (Fig. 8). Whereas in the second year, all the
3 mean values are high along track A with a decrease along track Band C, the decrease
in chlorophyll a in the first year and increase in zooplankton and Limacina inflata
suggests that the secondary producers have established themselves after a long period
of grazing. In the second year, primary producers are abundant and secondary producers
are less abundant, giving an impression that the secondary producers have just started
M. SAKTHlVEL:
zooplankton displacement volume and Limacina inflata are given in Fig. 8. The mean
annual variation is given in Table 2.
Table 2. Mean annual variation in chlorophyll a, zooplankton displacement volume and Limacina
inflata along 78 0 E
Year
Mean chlorophyll a
Mean zooplankton
Mean number of
displacement volume
Limacina inflata
mgm- 3
mlm- 3
Nom- 3
Dec. 1962 - Jan. 63 0·034
0·053
0·85
Dec. 1963 - Jan. 64 0·118
0·025
0·32
I 0.14
~-"
1.4
11 0.10
1.0
..,
;:;
-.
I
7 E r
E
E- 0.06 ..........
e>E
0.6 ~
Eo
....
- >
.... ........... ::.. ...
d
°vi
z
='6 0.02
..... ".:.:.:.::; . .:.:, . .:.:..:. ........ ---..,.
0.2 ~
£:!0.5 0 ....
~
~~
....
1962-63
.....
0
c
~~ 0.10 .. '
1.0 'u
..
0
~~
E
:::;:c
'.
:.:J
:il 0,06 -------.........
0.6 c
.....
..
:il
:::;:
....
0.Q2~
:::;:
0.2
A
B
C
Cruise tracks
Fig. 8. Mean annual variation of Limacina inflata, chlorophyll a and zooplankton displacement
volume in 3 selected tracks along 78
0
£
From Table 2 it is clear that chlorophyll a is low in the first year, but zooplankton
and numbers of Limacina inflata are high. In the second year, chlorophyll a is more than
3 times as abundant, zooplankton is less than half as abundant and Limacina inflata
about 3 times less abundant when compared to the mean values of the first year. In the
first year, track B shows high abundance in all 3 values while track A shows slightly
less abundance and track C poor abundance (Fig. 8). Whereas in the second year, all the
3 mean values are high along track A with a decrease along track Band C, the decrease
in chlorophyll a in the first year and increase in zooplankton and Limacina inflata
suggests that the secondary producers have established themselves after a long period
of grazing. In the second year, primary producers are abundant and secondary producers
are less abundant, giving an impression that the secondary producers have just started