

390
M. SAKTHIVEL:
III. Annual Variation of Limacina inflata along 78 0 E
"Umitaka Maru" and "Kagoshima Maru", 2 Japanese research vessels, during the
IIOE took a series of collections along the meridian 78
0
E during December to January
1962 -1963 and December to January 1963 -1964. Twenty zooplankton collections
during the first year and 23 during the second year were made along the track between
N
10"
• ,.
I
•
•
· •
· -
·
-®
t
•
• Doc· Jan 1962 -&3
• Dec. -Jon 1963 - 61.
UM ITAKAMARU
KAGOSHIMAMARU
100"
110"
E
-18
©
o
160
o
1'0
o Seasonal stohons 12:
• Refer"""" stotions
0
~~~~A
10:
80
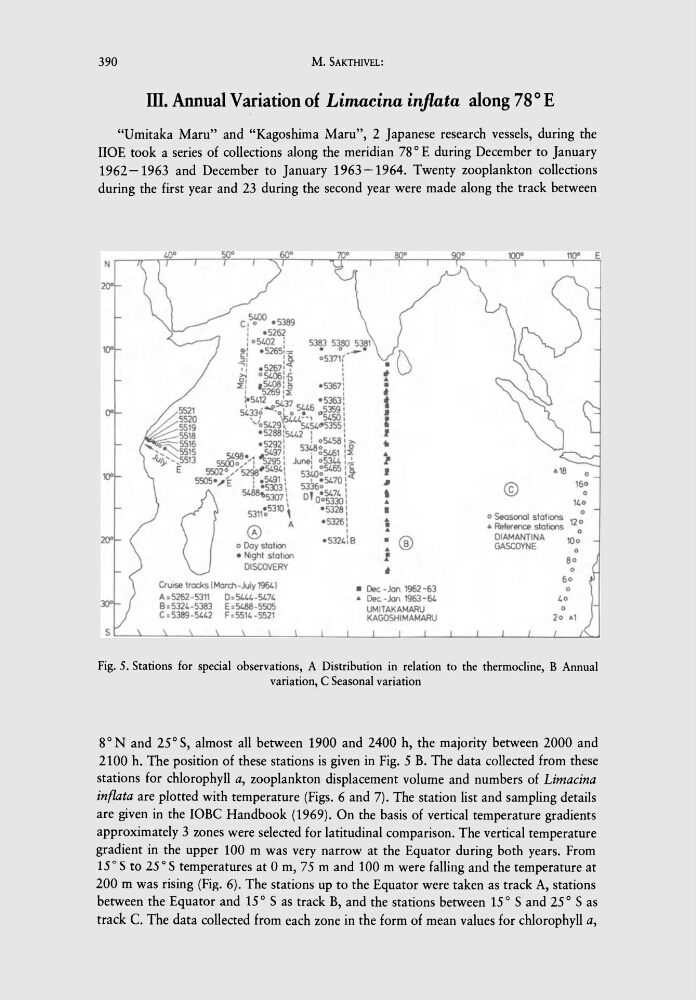
Fig. 5. Stations for special observations, A Distribution in relation to the thermocline, B Annual
variation, C Seasonal variation
8 0 Nand 25 0 S, almost all between 1900 and 2400 h, the majority between 2000 and
2100 h. The position of these stations is given in Fig. 5 B. The data collected from these
stations for chlorophyll a, zooplankton displacement volume and numbers of Limacina
inflata are plotted with temperature (Figs. 6 and 7). The station list and sampling details
are given in the lOBe Handbook (1969). On the basis of vertical temperature gradients
approximately 3 zones were selected for latitudinal comparison. The vertical temperature
gradient in the upper 100 m was very narrow at the Equator during both years. From
lr S to 25° S temperatures at a m, 75 m and 100 m were falling and the temperature at
200 m was rising (Fig. 6). The stations up to the Equator were taken as track A, stations
between the Equator and 15 0 S as track B, and the stations between 150 Sand 25 0 S as
track C. The data collected from each zone in the form of mean values for chlorophyll a,
M. SAKTHIVEL:
III. Annual Variation of Limacina inflata along 78 0 E
"Umitaka Maru" and "Kagoshima Maru", 2 Japanese research vessels, during the
IIOE took a series of collections along the meridian 78
0
E during December to January
1962 -1963 and December to January 1963 -1964. Twenty zooplankton collections
during the first year and 23 during the second year were made along the track between
N
10"
• ,.
I
•
•
· •
· -
·
-®
t
•
• Doc· Jan 1962 -&3
• Dec. -Jon 1963 - 61.
UM ITAKAMARU
KAGOSHIMAMARU
100"
110"
E
-18
©
o
160
o
1'0
o Seasonal stohons 12:
• Refer"""" stotions
0
~~~~A
10:
80
Fig. 5. Stations for special observations, A Distribution in relation to the thermocline, B Annual
variation, C Seasonal variation
8 0 Nand 25 0 S, almost all between 1900 and 2400 h, the majority between 2000 and
2100 h. The position of these stations is given in Fig. 5 B. The data collected from these
stations for chlorophyll a, zooplankton displacement volume and numbers of Limacina
inflata are plotted with temperature (Figs. 6 and 7). The station list and sampling details
are given in the lOBe Handbook (1969). On the basis of vertical temperature gradients
approximately 3 zones were selected for latitudinal comparison. The vertical temperature
gradient in the upper 100 m was very narrow at the Equator during both years. From
lr S to 25° S temperatures at a m, 75 m and 100 m were falling and the temperature at
200 m was rising (Fig. 6). The stations up to the Equator were taken as track A, stations
between the Equator and 15 0 S as track B, and the stations between 150 Sand 25 0 S as
track C. The data collected from each zone in the form of mean values for chlorophyll a,