

332
L. R. KASTURlRANGAN, M. SARASWATHY, and T. C. GOPALAKRISHNAN:
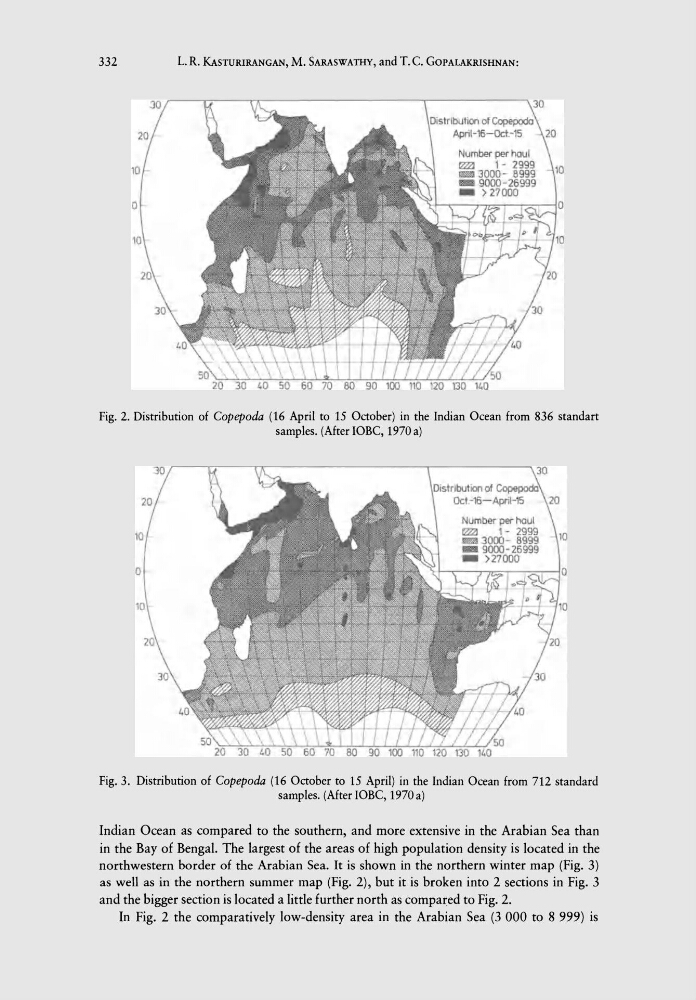
Fig. 2. Distribution of Copepoda (16 April to 15 October) in the Indian Ocean from 836 standart
samples. (After IOBC, 1970 a)
Fig. 3. Distribution of Copepoda (16 October to 15 April) in the Indian Ocean from 712 standard
samples. (After IOBC, 1970 a)
Indian Ocean as compared to the southern, and more extensive in the Arabian Sea than
in the Bay of Bengal. The largest of the areas of high population density is located in the
northwestern border of the Arabian Sea. It is shown in the northern winter map (Fig. 3)
as well as in the northern summer map (Fig. 2), but it is broken into 2 sections in Fig. 3
and the bigger section is located a little further north as compared to Fig. 2.
In Fig. 2 the comparatively low-density area in the Arabian Sea (3 000 to 8 999) is
L. R. KASTURlRANGAN, M. SARASWATHY, and T. C. GOPALAKRISHNAN:
Fig. 2. Distribution of Copepoda (16 April to 15 October) in the Indian Ocean from 836 standart
samples. (After IOBC, 1970 a)
Fig. 3. Distribution of Copepoda (16 October to 15 April) in the Indian Ocean from 712 standard
samples. (After IOBC, 1970 a)
Indian Ocean as compared to the southern, and more extensive in the Arabian Sea than
in the Bay of Bengal. The largest of the areas of high population density is located in the
northwestern border of the Arabian Sea. It is shown in the northern winter map (Fig. 3)
as well as in the northern summer map (Fig. 2), but it is broken into 2 sections in Fig. 3
and the bigger section is located a little further north as compared to Fig. 2.
In Fig. 2 the comparatively low-density area in the Arabian Sea (3 000 to 8 999) is