

Physical Oceanography of the Indian Ocean
20'
40'
60'
10'
O'
10'
- -
20'
60'
20'
o·
;;0'
40'
,. -+
- -
-
-+
10 '
40'
60'
80'
100'
80'
100'
80'
100'
120'
UO'E
SURfACE
CURRENTS
120'
UO'
SURfACE
CURRENTS
AUGUST
120'
140'E
19
10'
20'
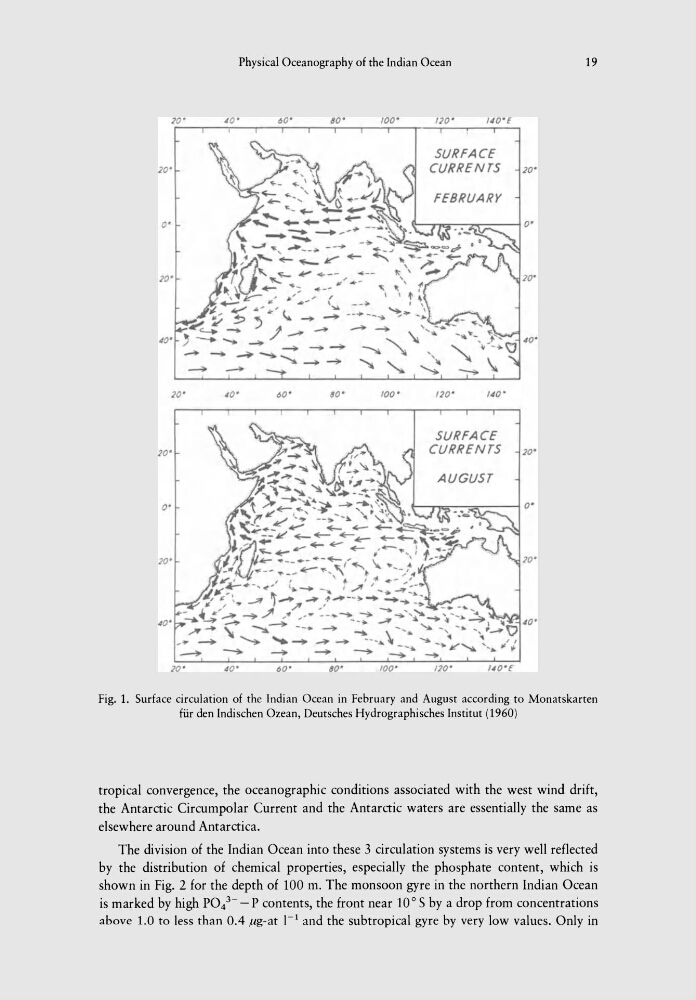
Fig. 1. Surface circulation of the Indian Ocean in February and August according to Monatskarten
fur den Indischen Ozean, Deutsches Hydrographisches Institut (1960)
tropical convergence, the oceanographic conditions associated with the west wind drift,
the Antarctic Circumpolar Current and the Antarctic waters are essentially the same as
elsewhere around Antarctica.
The division of the Indian Ocean into these 3 circulation systems is very well reflected
by the distribution of chemical properties, especially the phosphate content, which is
shown in Fig. 2 for the depth of 100 m. The monsoon gyre in the northern Indian Ocean
is marked by high P04 3 - - P contents, the front near 10° S by a drop from concentrations
above 1.0 to less than 0.4 Jig-at I-I and the subtropical gyre by very low values. Only in
20'
40'
60'
10'
O'
10'
- -
20'
60'
20'
o·
;;0'
40'
,. -+
- -
-
-+
10 '
40'
60'
80'
100'
80'
100'
80'
100'
120'
UO'E
SURfACE
CURRENTS
120'
UO'
SURfACE
CURRENTS
AUGUST
120'
140'E
19
10'
20'
Fig. 1. Surface circulation of the Indian Ocean in February and August according to Monatskarten
fur den Indischen Ozean, Deutsches Hydrographisches Institut (1960)
tropical convergence, the oceanographic conditions associated with the west wind drift,
the Antarctic Circumpolar Current and the Antarctic waters are essentially the same as
elsewhere around Antarctica.
The division of the Indian Ocean into these 3 circulation systems is very well reflected
by the distribution of chemical properties, especially the phosphate content, which is
shown in Fig. 2 for the depth of 100 m. The monsoon gyre in the northern Indian Ocean
is marked by high P04 3 - - P contents, the front near 10° S by a drop from concentrations
above 1.0 to less than 0.4 Jig-at I-I and the subtropical gyre by very low values. Only in