

16
D. H. JOHNSON:
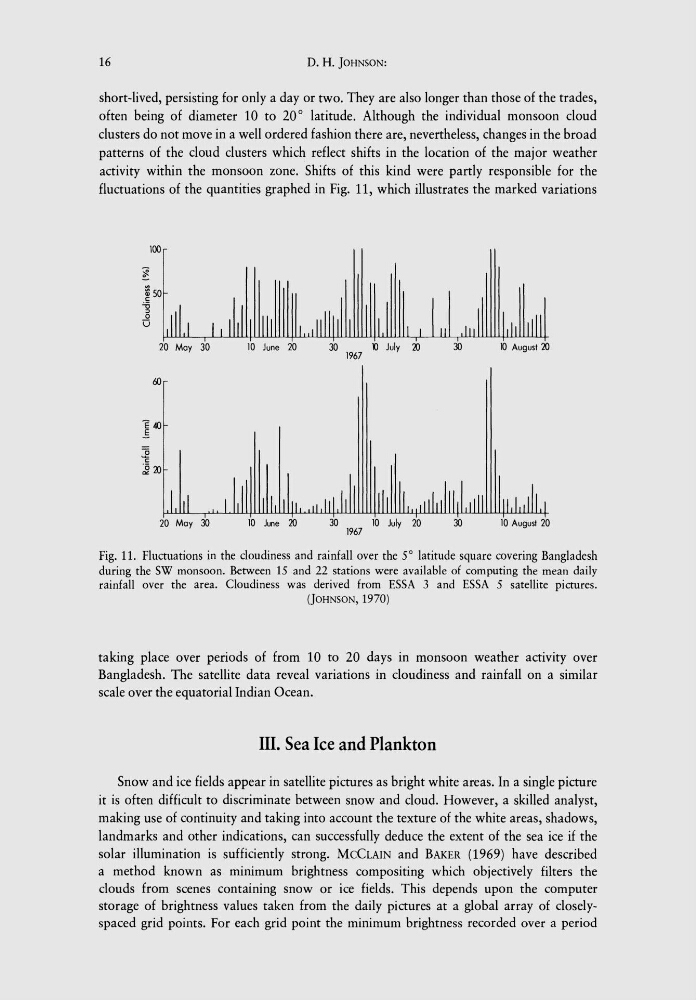
short-lived, persisting for only a day or two. They are also longer than those of the trades,
often being of diameter 10 to 20° latitude. Although the individual monsoon cloud
clusters do not move in a well ordered fashion there are, nevertheless, changes in the broad
patterns of the cloud clusters which reflect shifts in the location of the major weather
activity within the monsoon zone. Shifts of this kind were partly responsible for the
fluctuations of the quantities graphed in Fig. 11, which illustrates the marked variations
100
~
~ 50
c
'ii
" 0
D
20 May 30
10 June 20
30
Xl July 20
30
10 August 20
1967
60
E40
..5
:E c
~20
20 May 30
10 June 20
30
10 July 20
30
10 August 20
1967
Fig. 11. Fluctuations in the cloudiness and rainfall over the 5° latitude square covering Bangladesh
during the SW monsoon. Between 15 and 22 stations were available of computing the mean daily
rainfall over the area. Cloudiness was derived from ESSA 3 and ESSA 5 satellite pictures.
(JOHNSON, 1970)
taking place over periods of from 10 to 20 days in monsoon weather actlVlty over
Bangladesh. The satellite data reveal variations in cloudiness and rainfall on a similar
scale over the equatorial Indian Ocean.
III. Sea Ice and Plankton
Snow and ice fields appear in satellite pictures as bright white areas. In a single picture
it is often difficult to discriminate between snow and cloud. However, a skilled analyst,
making use of continuity and taking into account the texture of the white areas, shadows,
landmarks and other indications, can successfully deduce the extent of the sea ice if the
solar illumination is sufficiently strong. MCCLAIN and BAKER (1969) have described
a method known as minimum brightness compo siting which objectively filters the
clouds from scenes containing snow or ice fields. This depends upon the computer
storage of brightness values taken from the daily pictures at a global array of closelyspaced grid points. For each grid point the minimum brightness recorded over a period
D. H. JOHNSON:
short-lived, persisting for only a day or two. They are also longer than those of the trades,
often being of diameter 10 to 20° latitude. Although the individual monsoon cloud
clusters do not move in a well ordered fashion there are, nevertheless, changes in the broad
patterns of the cloud clusters which reflect shifts in the location of the major weather
activity within the monsoon zone. Shifts of this kind were partly responsible for the
fluctuations of the quantities graphed in Fig. 11, which illustrates the marked variations
100
~
~ 50
c
'ii
" 0
D
20 May 30
10 June 20
30
Xl July 20
30
10 August 20
1967
60
E40
..5
:E c
~20
20 May 30
10 June 20
30
10 July 20
30
10 August 20
1967
Fig. 11. Fluctuations in the cloudiness and rainfall over the 5° latitude square covering Bangladesh
during the SW monsoon. Between 15 and 22 stations were available of computing the mean daily
rainfall over the area. Cloudiness was derived from ESSA 3 and ESSA 5 satellite pictures.
(JOHNSON, 1970)
taking place over periods of from 10 to 20 days in monsoon weather actlVlty over
Bangladesh. The satellite data reveal variations in cloudiness and rainfall on a similar
scale over the equatorial Indian Ocean.
III. Sea Ice and Plankton
Snow and ice fields appear in satellite pictures as bright white areas. In a single picture
it is often difficult to discriminate between snow and cloud. However, a skilled analyst,
making use of continuity and taking into account the texture of the white areas, shadows,
landmarks and other indications, can successfully deduce the extent of the sea ice if the
solar illumination is sufficiently strong. MCCLAIN and BAKER (1969) have described
a method known as minimum brightness compo siting which objectively filters the
clouds from scenes containing snow or ice fields. This depends upon the computer
storage of brightness values taken from the daily pictures at a global array of closelyspaced grid points. For each grid point the minimum brightness recorded over a period