

278
M. VANNUCCI and D. NAVAS:
for any 2 species. Table 1 shows the basic distribution of some of the species studied.
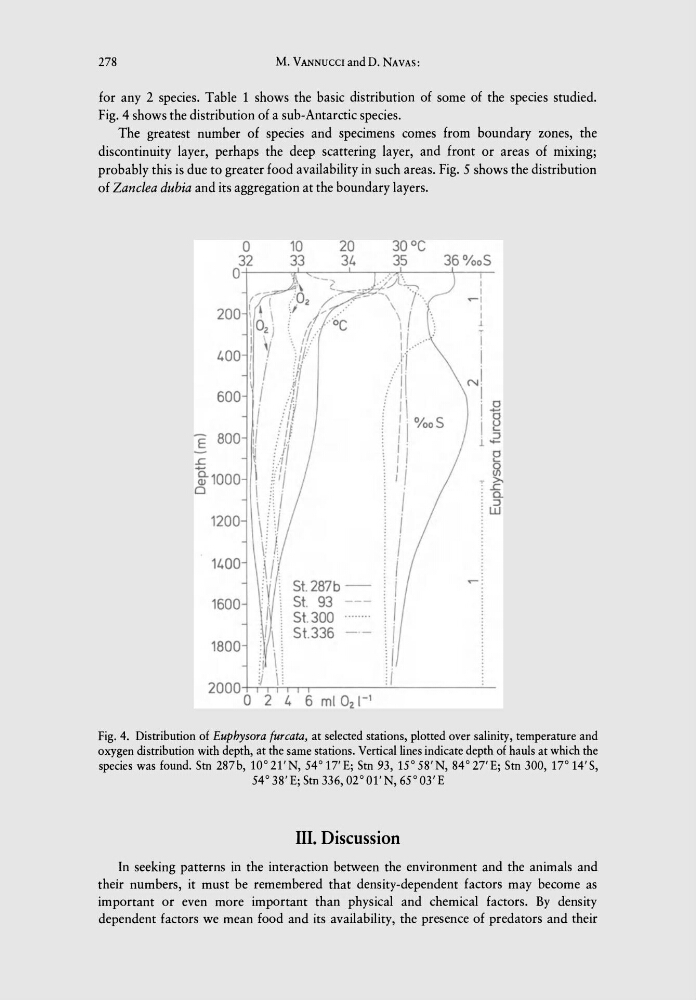
Fig. 4 shows the distribution of a sub-Antarctic species.
The greatest number of species and specimens comes from boundary zones, the
discontinuity layer, perhaps the deep scattering layer, and front or areas of mixing;
probably this is due to greater food availability in such areas. Fig. 5 shows the distribution
of Zanclea dubia and its aggregation at the boundary layers.
o
32
10
33
20
31.
30°C
35
36%05
O +-----~~----~-.~~-----;---. I
200
400
I
I
~ I
I
I
.1
y
1
i
(' .Ii
E 800
I
i .E
· 8
I ....
. :J
1 -
r.
g.1000
~
~ >.
: r.
. 0.
o
1200
1400
1600
1800
5t.287b -
5t. 93
5t. 300
5t.336
: :J
: W
2000 +TO+".-----~~------~
o 2 4 6 m l 0
2 1- 1
Fig. 4. Distribution of Euphysora furcata, at selected stations, plotted over salinity, temperature and
oxygen distribution with depth, at the same stations. Vertical lines indicate depth of hauls at which the
species was found. Stn 287b, 10° 21'N, 54° 17'E; Stn 93,15° 58'N, 84° 27'E; Stu 300,17° 14'S,
54° 38'E; Stn 336, 02°01'N, 65°03'E
III. Discussion
In seeking patterns in the interaction between the environment and the animals and
their numbers, it must be remembered that density-dependent factors may become as
important or even more important than physical and chemical factors. By density
dependent factors we mean food and its availability, the presence of predators and their
M. VANNUCCI and D. NAVAS:
for any 2 species. Table 1 shows the basic distribution of some of the species studied.
Fig. 4 shows the distribution of a sub-Antarctic species.
The greatest number of species and specimens comes from boundary zones, the
discontinuity layer, perhaps the deep scattering layer, and front or areas of mixing;
probably this is due to greater food availability in such areas. Fig. 5 shows the distribution
of Zanclea dubia and its aggregation at the boundary layers.
o
32
10
33
20
31.
30°C
35
36%05
O +-----~~----~-.~~-----;---. I
200
400
I
I
~ I
I
I
.1
y
1
i
(' .Ii
E 800
I
i .E
· 8
I ....
. :J
1 -
r.
g.1000
~
~ >.
: r.
. 0.
o
1200
1400
1600
1800
5t.287b -
5t. 93
5t. 300
5t.336
: :J
: W
2000 +TO+".-----~~------~
o 2 4 6 m l 0
2 1- 1
Fig. 4. Distribution of Euphysora furcata, at selected stations, plotted over salinity, temperature and
oxygen distribution with depth, at the same stations. Vertical lines indicate depth of hauls at which the
species was found. Stn 287b, 10° 21'N, 54° 17'E; Stn 93,15° 58'N, 84° 27'E; Stu 300,17° 14'S,
54° 38'E; Stn 336, 02°01'N, 65°03'E
III. Discussion
In seeking patterns in the interaction between the environment and the animals and
their numbers, it must be remembered that density-dependent factors may become as
important or even more important than physical and chemical factors. By density
dependent factors we mean food and its availability, the presence of predators and their