

254
T. S. S. RAo:
of most of these groups follows the same pattern as that of the copepods, fish eggs and
larvae, the richest region being the Saudi Arabia and Somali coasts. For example,
amphipods show a great abundance along the coasts of Oman, Somalia, west coast of
Burma and off the southern coast of Java, increasing in general towards the northern
part of the Indian Ocean. Their numbers decrease southwards.
Chaetognaths, too, show a similar distribution. The highest density was recorded
in the western part of the Arabian Sea and their numbers also decrease southwards. It
should be noted, however, that the concentration of these groups overlaps and also
radiates from the areas of upwelling. This would be expected because the development
of maximum populations of carnivores or omnivorous groups of plankton takes some
time in the sequency of biological events in the sea. Firstly, there is local enrichment due
to upwelling and as the surface waters get fertilized and spread under the influence of
the local currents, the development of the phytoplankton population is displaced in
space and time, and by the time copepods and their predators begin their population
explosion, they may be located quite some distance from the area of upwelling. This is
precisely what happens in the case of distribution and abundance of copepods, fish
larvae and chaetognaths, amphipods and other groups in the northern Arabian Sea and
the Bay of Bengal (see Plankton Atlases Vols I and II, IOBC, 1968, 1970).
VII. Numerical Distribution
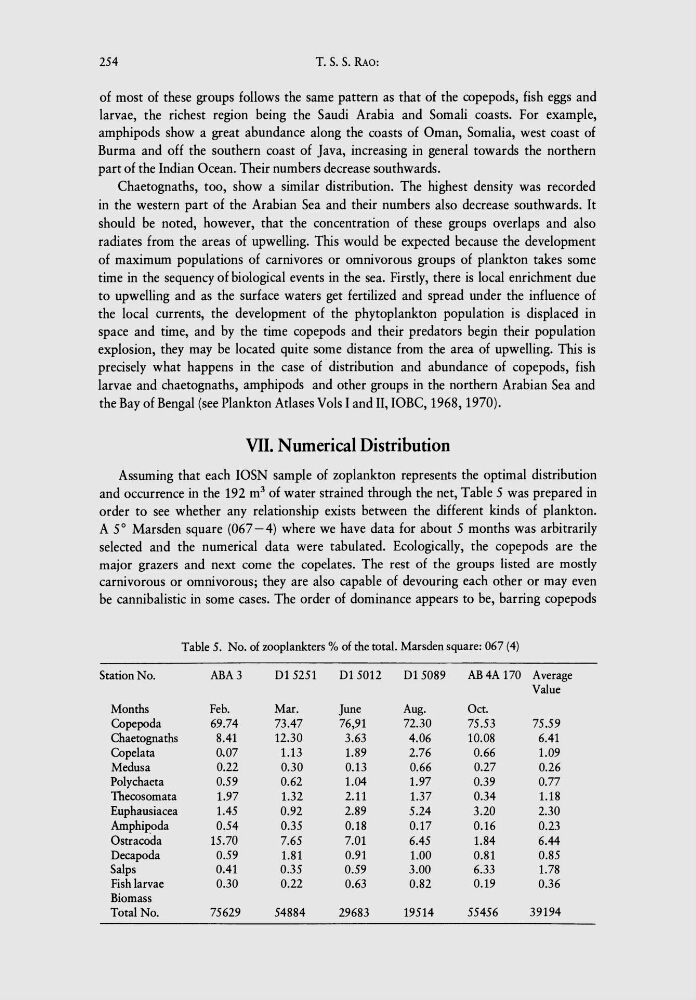
Assuming that each IOSN sample of zoplankton represents the optimal distribution
and occurrence in the 192 m 3 of water strained through the net, Table 5 was prepared in
order to see whether any relationship exists between the different kinds of plankton.
A 5° Marsden square (067 -4) where we have data for about 5 months was arbitrarily
selected and the numerical data were tabulated. Ecologically, the copepods are the
major grazers and next come the copelates. The rest of the groups listed are mostly
carnivorous or omnivorous; they are also capable of devouring each other or may even
be cannibalistic in some cases. The order of dominance appears to be, barring copepods
Table 5. No. of zooplankters % of the total. Marsden square: 067 (4)
Station No.
ABA 3
D15251
D15012
D15089
AB4A 170 Average
Value
Months
Feb.
Mar.
June
Aug.
Oct.
Copepoda
69.74
73.47
76,91
72.30
75.53
75.59
Chaetognaths
8.41
12.30
3.63
4.06
10.08
6.41
Copelata
0,07
1.13
1.89
2.76
0.66
1.09
Medusa
0.22
0.30
0.13
0.66
0.27
0.26
Polychaeta
0.59
0.62
1.04
1.97
0.39
0.77
Thecosomata
1.97
1.32
2.11
1.37
0.34
1.18
Euphausiacea
1.45
0.92
2.89
5.24
3.20
2.30
Amphipoda
0.54
0.35
0.18
0.17
0.16
0.23
Ostracoda
15.70
7.65
7.01
6.45
1.84
6.44
Decapoda
0.59
1.81
0.91
1.00
0.81
0.85
Salps
0.41
0.35
0.59
3.00
6.33
1.78
Fish larvae
0.30
0.22
0.63
0.82
0.19
0.36
Biomass
Total No.
75629
54884
29683
19514
55456
39194
T. S. S. RAo:
of most of these groups follows the same pattern as that of the copepods, fish eggs and
larvae, the richest region being the Saudi Arabia and Somali coasts. For example,
amphipods show a great abundance along the coasts of Oman, Somalia, west coast of
Burma and off the southern coast of Java, increasing in general towards the northern
part of the Indian Ocean. Their numbers decrease southwards.
Chaetognaths, too, show a similar distribution. The highest density was recorded
in the western part of the Arabian Sea and their numbers also decrease southwards. It
should be noted, however, that the concentration of these groups overlaps and also
radiates from the areas of upwelling. This would be expected because the development
of maximum populations of carnivores or omnivorous groups of plankton takes some
time in the sequency of biological events in the sea. Firstly, there is local enrichment due
to upwelling and as the surface waters get fertilized and spread under the influence of
the local currents, the development of the phytoplankton population is displaced in
space and time, and by the time copepods and their predators begin their population
explosion, they may be located quite some distance from the area of upwelling. This is
precisely what happens in the case of distribution and abundance of copepods, fish
larvae and chaetognaths, amphipods and other groups in the northern Arabian Sea and
the Bay of Bengal (see Plankton Atlases Vols I and II, IOBC, 1968, 1970).
VII. Numerical Distribution
Assuming that each IOSN sample of zoplankton represents the optimal distribution
and occurrence in the 192 m 3 of water strained through the net, Table 5 was prepared in
order to see whether any relationship exists between the different kinds of plankton.
A 5° Marsden square (067 -4) where we have data for about 5 months was arbitrarily
selected and the numerical data were tabulated. Ecologically, the copepods are the
major grazers and next come the copelates. The rest of the groups listed are mostly
carnivorous or omnivorous; they are also capable of devouring each other or may even
be cannibalistic in some cases. The order of dominance appears to be, barring copepods
Table 5. No. of zooplankters % of the total. Marsden square: 067 (4)
Station No.
ABA 3
D15251
D15012
D15089
AB4A 170 Average
Value
Months
Feb.
Mar.
June
Aug.
Oct.
Copepoda
69.74
73.47
76,91
72.30
75.53
75.59
Chaetognaths
8.41
12.30
3.63
4.06
10.08
6.41
Copelata
0,07
1.13
1.89
2.76
0.66
1.09
Medusa
0.22
0.30
0.13
0.66
0.27
0.26
Polychaeta
0.59
0.62
1.04
1.97
0.39
0.77
Thecosomata
1.97
1.32
2.11
1.37
0.34
1.18
Euphausiacea
1.45
0.92
2.89
5.24
3.20
2.30
Amphipoda
0.54
0.35
0.18
0.17
0.16
0.23
Ostracoda
15.70
7.65
7.01
6.45
1.84
6.44
Decapoda
0.59
1.81
0.91
1.00
0.81
0.85
Salps
0.41
0.35
0.59
3.00
6.33
1.78
Fish larvae
0.30
0.22
0.63
0.82
0.19
0.36
Biomass
Total No.
75629
54884
29683
19514
55456
39194