

240
]. LENZ:
II. Zooplankton Biomass
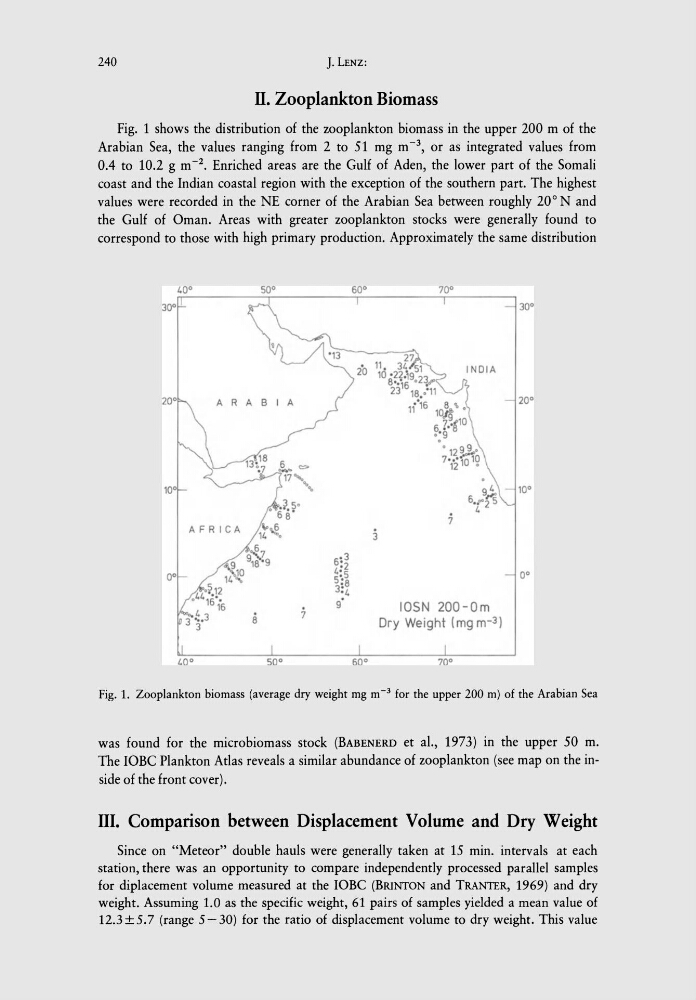
Fig. 1 shows the distribution of the zooplankton biomass in the upper 200 m of the
Arabian Sea, the values ranging from 2 to 51 mg m-\ or as integrated values from
0.4 to 10.2 g m- 2 • Enriched areas are the Gulf of Aden, the lower part of the Somali
coast and the Indian coastal region with the exception of the southern part. The highest
values were recorded in the NE corner of the Arabian Sea between roughly 20° Nand
the Gulf of Oman. Areas with greater zooplankton stocks were generally found to
correspond to those with high primary production. Approximately the same distribution
70°
30°
27
11 . 34 51
10 8~.{.19.23 ...
2316 18.':"
20·
A R A B I A
1(16 ~'.
10
6 ?.~10
0;9
• 12 99 •
7 .. ·ro;O
12
•
10
9 4
10°
6 .... rs
I.
:7
3
6: 3
4:2
0°
0°
5··5
3: 8
-I.
:7
9IOSN 200-0m
Ii
Dry Weight (mg m- 3 )
50°
60°
70°
Fig. 1. Zooplankton biomass (average dry weight mg m- 3 for the upper 200 m) of the Arabian Sea
was found for the micro biomass stock (BABENERD et al., 1973) in the upper 50 m.
The IOBC Plankton Atlas reveals a similar abundance of zooplankton (see map on the inside of the front cover).
III. Comparison between Displacement Volume and Dry Weight
Since on "Meteor" double hauls were generally taken at 15 min. intervals at each
station, there was an opportunity to compare independently processed parallel samples
for diplacement volume measured at the IOBC (BRINTON and TRANTER, 1969) and dry
weight. Assuming 1.0 as the specific weight, 61 pairs of samples yielded a mean value of
12.3 ± 5.7 (range 5 - 30) for the ratio of displacement volume to dry weight. This value
]. LENZ:
II. Zooplankton Biomass
Fig. 1 shows the distribution of the zooplankton biomass in the upper 200 m of the
Arabian Sea, the values ranging from 2 to 51 mg m-\ or as integrated values from
0.4 to 10.2 g m- 2 • Enriched areas are the Gulf of Aden, the lower part of the Somali
coast and the Indian coastal region with the exception of the southern part. The highest
values were recorded in the NE corner of the Arabian Sea between roughly 20° Nand
the Gulf of Oman. Areas with greater zooplankton stocks were generally found to
correspond to those with high primary production. Approximately the same distribution
70°
30°
27
11 . 34 51
10 8~.{.19.23 ...
2316 18.':"
20·
A R A B I A
1(16 ~'.
10
6 ?.~10
0;9
• 12 99 •
7 .. ·ro;O
12
•
10
9 4
10°
6 .... rs
I.
:7
3
6: 3
4:2
0°
0°
5··5
3: 8
-I.
:7
9IOSN 200-0m
Ii
Dry Weight (mg m- 3 )
50°
60°
70°
Fig. 1. Zooplankton biomass (average dry weight mg m- 3 for the upper 200 m) of the Arabian Sea
was found for the micro biomass stock (BABENERD et al., 1973) in the upper 50 m.
The IOBC Plankton Atlas reveals a similar abundance of zooplankton (see map on the inside of the front cover).
III. Comparison between Displacement Volume and Dry Weight
Since on "Meteor" double hauls were generally taken at 15 min. intervals at each
station, there was an opportunity to compare independently processed parallel samples
for diplacement volume measured at the IOBC (BRINTON and TRANTER, 1969) and dry
weight. Assuming 1.0 as the specific weight, 61 pairs of samples yielded a mean value of
12.3 ± 5.7 (range 5 - 30) for the ratio of displacement volume to dry weight. This value