

Recent Satellite Studies
9
sea surface of about 4 nautical miles. These data allow the temperature of the radiating
surfaces beneath the satellite to be calculated. Over the oceans for clear skies the temperatures derived are those of the sea surface. The main problem arising in the mapping
of sea surface temperatures from these data lies in the separation of the clear sky values
from those contaminated by cloud. Most areas of cloud can be identified by their
appreciably lower temperatures in comparison with those of the cloud-free ocean surface
nearby and in analyses given for individual days by WARNECKE, McMILLIN and ALLISON
(1969) such cloudy areas are simply excluded. In other studies several days measurements for individual 1
0
latitude or larger squares have been examined and the highest
value selected as representative for the sea surface, the argument again being that cloud40
10
SIRS Data
Radiosonde
Data
Temperature
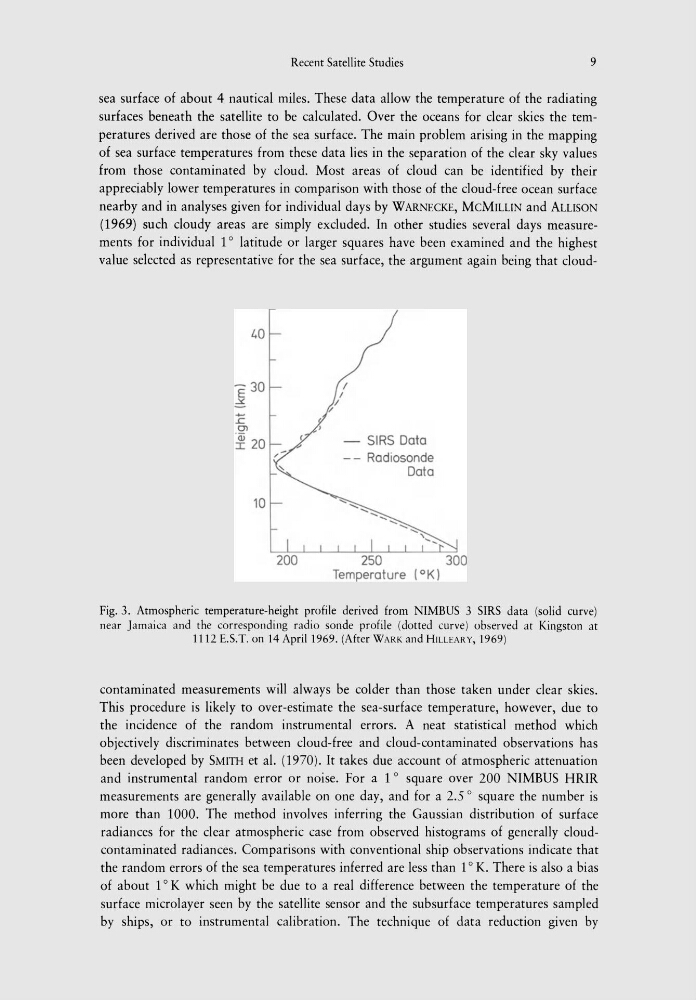
Fig. 3. Atmospheric temperature-height profile derived from NIMBUS 3 SIRS data (solid curve)
near Jamaica and the corresponding radio sonde profile (dotted curve) observed at Kingston at
1112 E.S.T. on 14 April 1969. (After WARK and HILLEARY, 1969)
contaminated measurements will always be colder than those taken under clear skies.
This procedure is likely to over-estimate the sea-surface temperature, however, due to
the incidence of the random instrumental errors. A neat statistical method which
objectively discriminates between cloud-free and cloud-contaminated observations has
been developed by SMITH et al. (1970). It takes due account of atmospheric attenuation
and instrumental random error or noise. For a 1 0 square over 200 NIMBUS HRIR
measurements are generally available on one day, and for a 2.5
0
square the number is
more than 1000. The method involves inferring the Gaussian distribution of surface
radiances for the clear atmospheric case from observed histograms of generally cloudcontaminated radiances. Comparisons with conventional ship observations indicate that
the random errors of the sea temperatures inferred are less than 1
0
K. There is also a bias
of about 1 0 K which might be due to a real difference between the temperature of the
surface microlayer seen by the satellite sensor and the subsurface temperatures sampled
by ships, or to instrumental calibration. The technique of data reduction given by
9
sea surface of about 4 nautical miles. These data allow the temperature of the radiating
surfaces beneath the satellite to be calculated. Over the oceans for clear skies the temperatures derived are those of the sea surface. The main problem arising in the mapping
of sea surface temperatures from these data lies in the separation of the clear sky values
from those contaminated by cloud. Most areas of cloud can be identified by their
appreciably lower temperatures in comparison with those of the cloud-free ocean surface
nearby and in analyses given for individual days by WARNECKE, McMILLIN and ALLISON
(1969) such cloudy areas are simply excluded. In other studies several days measurements for individual 1
0
latitude or larger squares have been examined and the highest
value selected as representative for the sea surface, the argument again being that cloud40
10
SIRS Data
Radiosonde
Data
Temperature
Fig. 3. Atmospheric temperature-height profile derived from NIMBUS 3 SIRS data (solid curve)
near Jamaica and the corresponding radio sonde profile (dotted curve) observed at Kingston at
1112 E.S.T. on 14 April 1969. (After WARK and HILLEARY, 1969)
contaminated measurements will always be colder than those taken under clear skies.
This procedure is likely to over-estimate the sea-surface temperature, however, due to
the incidence of the random instrumental errors. A neat statistical method which
objectively discriminates between cloud-free and cloud-contaminated observations has
been developed by SMITH et al. (1970). It takes due account of atmospheric attenuation
and instrumental random error or noise. For a 1 0 square over 200 NIMBUS HRIR
measurements are generally available on one day, and for a 2.5
0
square the number is
more than 1000. The method involves inferring the Gaussian distribution of surface
radiances for the clear atmospheric case from observed histograms of generally cloudcontaminated radiances. Comparisons with conventional ship observations indicate that
the random errors of the sea temperatures inferred are less than 1
0
K. There is also a bias
of about 1 0 K which might be due to a real difference between the temperature of the
surface microlayer seen by the satellite sensor and the subsurface temperatures sampled
by ships, or to instrumental calibration. The technique of data reduction given by