

Productivity of Backwaters and Estuaries
151
prevail in the backwater, more particularly during the monsoon season. Monthly values
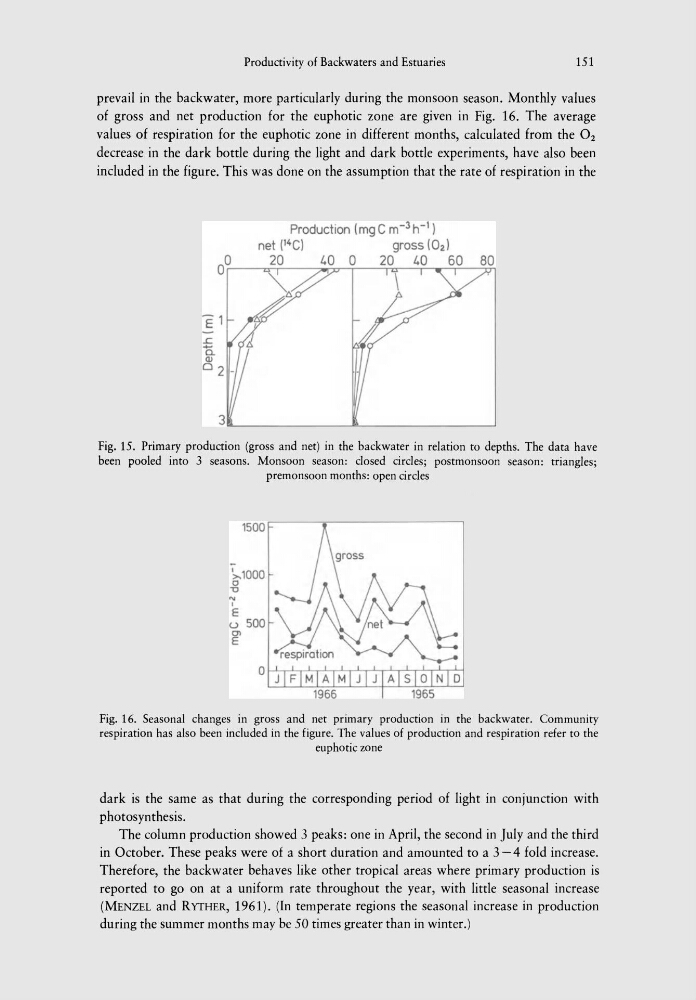
of gross and net production for the euphotic zone are given in Fig. 16. The average
values of respiration for the euphotic zone in different months, calculated from the O2
decrease in the dark bottle during the light and dark bottle experiments, have also been
included in the figure. This was done on the assumption that the rate of respiration in the
3L-____________ L -____________ ~
Fig. 15. Primary production (gross and net) in the backwater in relation to depths. The data have
been pooled into 3 seasons. Monsoon season: closed circles; postmonsoon season: triangles;
premonsoon months: open circles
'>-1000
c
"U
'" I
E
u
0>
E
Fig. 16. Seasonal changes in gross and net primary production in the backwater. Community
respiration has also been included in the figure. The values of production and respiration refer to the
euphotic zone
dark is the same as that during the corresponding period of light in conjunction with
photosynthesis.
The column production showed 3 peaks: one in April, the second in July and the third
in October. These peaks were of a short duration and amounted to a 3 -4 fold increase.
Therefore, the backwater behaves like other tropical areas where primary production is
reported to go on at a uniform rate throughout the year, with little seasonal increase
(MENZEL and RYTHER, 1961). (In temperate regions the seasonal increase in production
during the summer months may be 50 times greater than in winter.)
151
prevail in the backwater, more particularly during the monsoon season. Monthly values
of gross and net production for the euphotic zone are given in Fig. 16. The average
values of respiration for the euphotic zone in different months, calculated from the O2
decrease in the dark bottle during the light and dark bottle experiments, have also been
included in the figure. This was done on the assumption that the rate of respiration in the
3L-____________ L -____________ ~
Fig. 15. Primary production (gross and net) in the backwater in relation to depths. The data have
been pooled into 3 seasons. Monsoon season: closed circles; postmonsoon season: triangles;
premonsoon months: open circles
'>-1000
c
"U
'" I
E
u
0>
E
Fig. 16. Seasonal changes in gross and net primary production in the backwater. Community
respiration has also been included in the figure. The values of production and respiration refer to the
euphotic zone
dark is the same as that during the corresponding period of light in conjunction with
photosynthesis.
The column production showed 3 peaks: one in April, the second in July and the third
in October. These peaks were of a short duration and amounted to a 3 -4 fold increase.
Therefore, the backwater behaves like other tropical areas where primary production is
reported to go on at a uniform rate throughout the year, with little seasonal increase
(MENZEL and RYTHER, 1961). (In temperate regions the seasonal increase in production
during the summer months may be 50 times greater than in winter.)