

148
2.5
I
;2.0
S
tT
~ 1.5
;.,
~ to
~05
«
S. Z. QASIM:
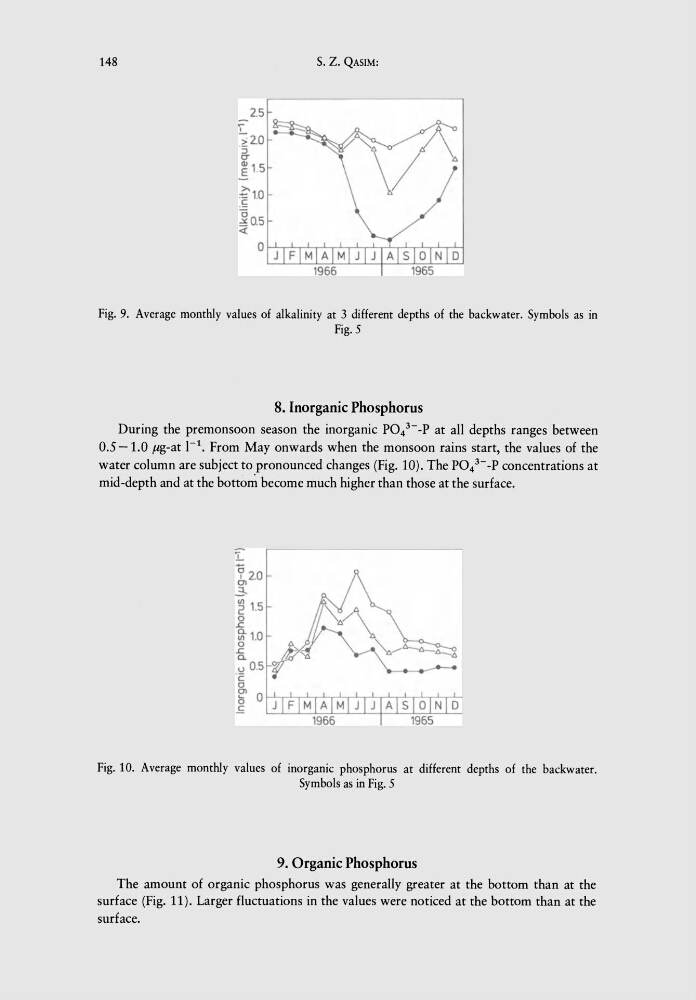
Fig. 9. Average monthly values of alkalinity at 3 different depths of the backwater. Symbols as in
Fig. 5
8. Inorganic Phosphorus
During the premonsoon season the inorganic P04 3 --P at all depths ranges between
0.5 -1.0 ,ug-at 1- 1 • From May onwards when the monsoon rains start, the values of the
water column are subject to pronounced changes (Fig. 10). The PO/--P concentrations at
mid-depth and at the bottorri become much higher than those at the surface.
Fig. 10. Average monthly values of inorganic phosphorus at different depths of the backwater.
Symbols as in Fig. 5
9. Organic Phosphorus
The amount of organic phosphorus was generally greater at the bottom than at the
surface (Fig. 11). Larger fluctuations in the values were noticed at the bottom than at the
surface.
2.5
I
;2.0
S
tT
~ 1.5
;.,
~ to
~05
«
S. Z. QASIM:
Fig. 9. Average monthly values of alkalinity at 3 different depths of the backwater. Symbols as in
Fig. 5
8. Inorganic Phosphorus
During the premonsoon season the inorganic P04 3 --P at all depths ranges between
0.5 -1.0 ,ug-at 1- 1 • From May onwards when the monsoon rains start, the values of the
water column are subject to pronounced changes (Fig. 10). The PO/--P concentrations at
mid-depth and at the bottorri become much higher than those at the surface.
Fig. 10. Average monthly values of inorganic phosphorus at different depths of the backwater.
Symbols as in Fig. 5
9. Organic Phosphorus
The amount of organic phosphorus was generally greater at the bottom than at the
surface (Fig. 11). Larger fluctuations in the values were noticed at the bottom than at the
surface.