

Light and Nutrients in the Indian Ocean
101
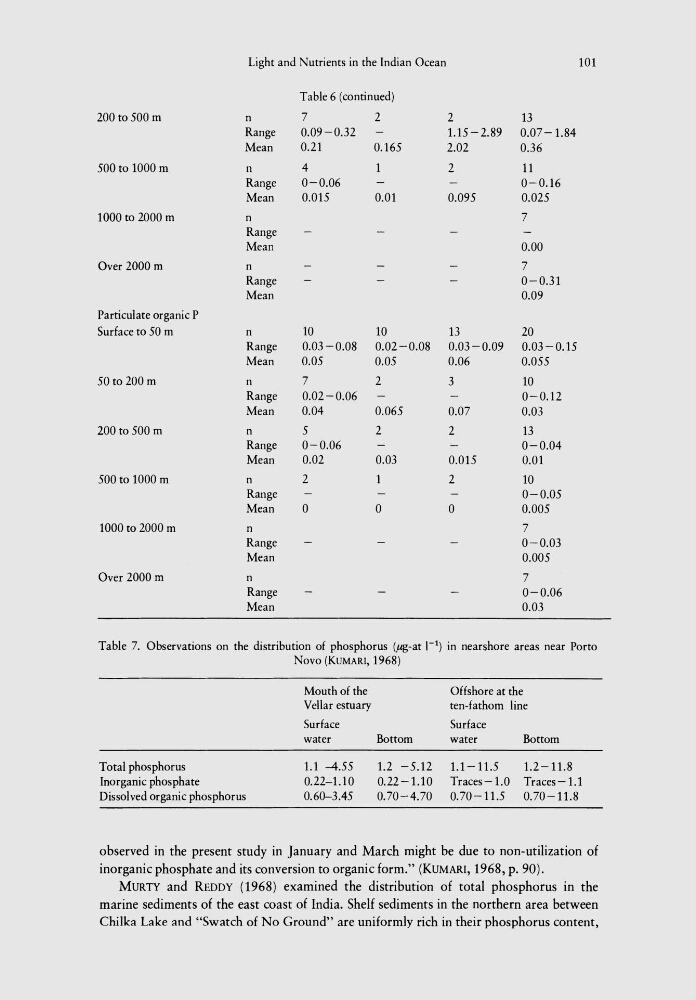
Table 6 (continued)
200 to 500 m
n
7
2
2
13
Range
0.09-0.32
1.15 - 2.89
0.07-1.84
Mean
0.21
0.165
2.02
0.36
500 to 1000 m
n
4
2
11
Range
0-0.06
0-0.16
Mean
0.015
0.01
0.095
0.025
1000 to 2000 m
n
7
Range
Mean
0.00
Over 2000 m
n
7
Range
0-0.31
Mean
0.09
Particulate organic P
Surface to 50 m
n
10
10
13
20
Range
0.03-0.08
0.02-0.08
0.03-0.09
0.03-0.15
Mean
0.05
0.05
0.06
0.055
50 to 200 m
n
7
2
3
10
Range
0.02-0.06
0-0.12
Mean
0.04
0.065
0.07
0.03
200 to 500 m
n
5
2
2
13
Range
0-0.06
0-0.04
Mean
0.02
0.03
0.015
0.01
500 to 1000 m
n
2
2
10
Range
0-0.05
Mean
0
0
0
0.005
1000 to 2000 m
n
7
Range
0-0.D3
Mean
0.005
Over 2000 m
n
7
Range
0-0.06
Mean
0.D3
Table 7. Observations on the distribution of phosphorus (,ug-at 1- 1 ) in nearshore areas near Porto
Novo (KUMAR!, 1968)
Mouth of the
Offshore at the
Vellar estuary
ten-fathom line
Surface
Surface
water
Bottom
water
Bottom
Total phosphorus
1.1 --4.55
1.2 -5.12
1.1-11.5
1.2-11.8
Inorganic phosphate
0.22-1.10
0.22-1.10 Traces-1.0 Traces-1.1
Dissolved organic phosphorus
0.60-3.45
0.70-4.70
0.70-11.5
0.70-11.8
observed in the present study in January and March might be due to non-utilization of
inorganic phosphate and its conversion to organic form." (KUMAR!, 1968, p. 90).
MURTY and REDDY (1968) examined the distribution of total phosphorus in the
marine sediments of the east coast of India. Shelf sediments in the northern area between
Chilka Lake and "Swatch of No Ground" are uniformly rich in their phosphorus content,
101
Table 6 (continued)
200 to 500 m
n
7
2
2
13
Range
0.09-0.32
1.15 - 2.89
0.07-1.84
Mean
0.21
0.165
2.02
0.36
500 to 1000 m
n
4
2
11
Range
0-0.06
0-0.16
Mean
0.015
0.01
0.095
0.025
1000 to 2000 m
n
7
Range
Mean
0.00
Over 2000 m
n
7
Range
0-0.31
Mean
0.09
Particulate organic P
Surface to 50 m
n
10
10
13
20
Range
0.03-0.08
0.02-0.08
0.03-0.09
0.03-0.15
Mean
0.05
0.05
0.06
0.055
50 to 200 m
n
7
2
3
10
Range
0.02-0.06
0-0.12
Mean
0.04
0.065
0.07
0.03
200 to 500 m
n
5
2
2
13
Range
0-0.06
0-0.04
Mean
0.02
0.03
0.015
0.01
500 to 1000 m
n
2
2
10
Range
0-0.05
Mean
0
0
0
0.005
1000 to 2000 m
n
7
Range
0-0.D3
Mean
0.005
Over 2000 m
n
7
Range
0-0.06
Mean
0.D3
Table 7. Observations on the distribution of phosphorus (,ug-at 1- 1 ) in nearshore areas near Porto
Novo (KUMAR!, 1968)
Mouth of the
Offshore at the
Vellar estuary
ten-fathom line
Surface
Surface
water
Bottom
water
Bottom
Total phosphorus
1.1 --4.55
1.2 -5.12
1.1-11.5
1.2-11.8
Inorganic phosphate
0.22-1.10
0.22-1.10 Traces-1.0 Traces-1.1
Dissolved organic phosphorus
0.60-3.45
0.70-4.70
0.70-11.5
0.70-11.8
observed in the present study in January and March might be due to non-utilization of
inorganic phosphate and its conversion to organic form." (KUMAR!, 1968, p. 90).
MURTY and REDDY (1968) examined the distribution of total phosphorus in the
marine sediments of the east coast of India. Shelf sediments in the northern area between
Chilka Lake and "Swatch of No Ground" are uniformly rich in their phosphorus content,