

216
M.L. Cancela et al.
EiD36
0.0
Id13
1.4
Hd46
4.2
LG21
-
0.0
RISP
640961.0
non_coding
1187937.0
cytoxidase_5A
4495254.0
Glyoxalase_I
5115217.0
CASC4
9051713.0
Ubiquitin_CTH_10
11101000.0
p22phox
11967303.0
non_coding
14461146.0
SPC18
15261512.0
Cyt_P450_19A1
18040624.0
non_coding
18439124.0
Transmprotein_208
18555030.0
GDP_f ucose_transporter_1
20617780.0
Sin3a
21393512.0
Cathepsin_D
21432464.0
ENSGACP00000022792
21512256.0
Cysteinyl_tRNA_synthetase
21567064.0
*
22105306.0
Chr II
Sapd01138
785.8
AF478569
714.1
Sapd01137
682.9
Sapd00677
605.3
Sapd00688
563.3
AJ418568
510.2
AJ418569
483.8
Sapd00311
458.5
AF399824
449.2
Sapd00582
442.9
Sapd00405
357.6
Sapd00110
341.5
Sapd00154
293.2
Sapd00681
253.1
Y17265
228.1
Sapd00087
169.6
Sapd00344
152.8
Hd46
140.8
Sapd00300
119.2
Sapd00146
56.8
Eid10
40.3
Sapd00377
36.5
Sapd01046
25.1
RH18
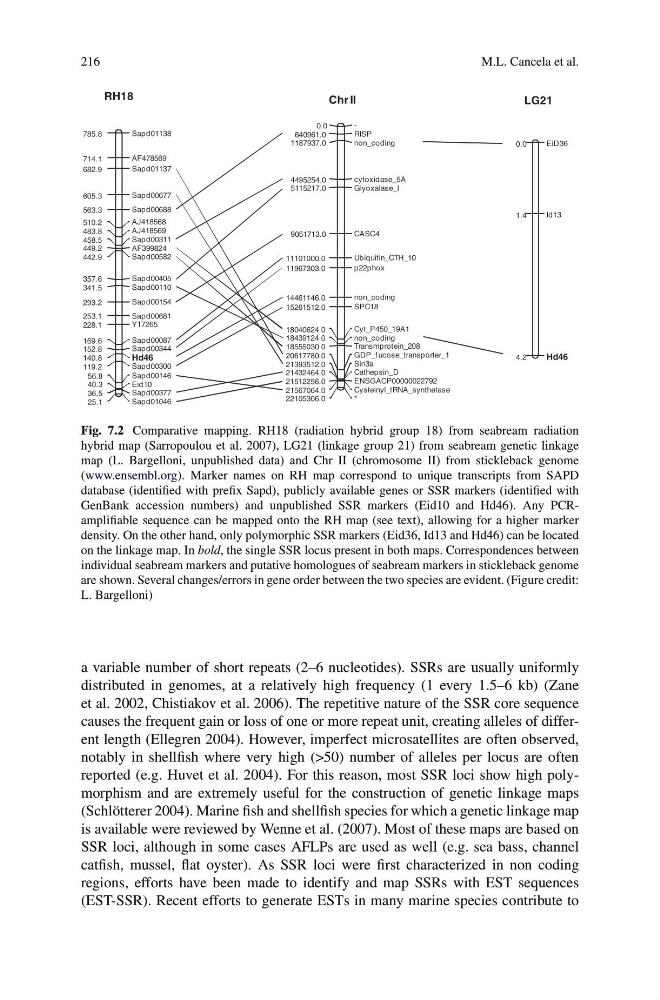
Fig. 7.2 Comparative mapping. RH18 (radiation hybrid group 18) from seabream radiation
hybrid map (Sarropoulou et al. 2007), LG21 (linkage group 21) from seabream genetic linkage
map (L. Bargelloni, unpublished data) and Chr II (chromosome II) from stickleback genome
(www.ensembl.org). Marker names on RH map correspond to unique transcripts from SAPD
database (identified with prefix Sapd), publicly available genes or SSR markers (identified with
GenBank accession numbers) and unpublished SSR markers (Eid10 and Hd46). Any PCRamplifiable sequence can be mapped onto the RH map (see text), allowing for a higher marker
density. On the other hand, only polymorphic SSR markers (Eid36, Id13 and Hd46) can be located
on the linkage map. In bold, the single SSR locus present in both maps. Correspondences between
individual seabream markers and putative homologues of seabream markers in stickleback genome
are shown. Several changes/errors in gene order between the two species are evident. (Figure credit:
L. Bargelloni)
a variable number of short repeats (2–6 nucleotides). SSRs are usually uniformly
distributed in genomes, at a relatively high frequency (1 every 1.5–6 kb) (Zane
et al. 2002, Chistiakov et al. 2006). The repetitive nature of the SSR core sequence
causes the frequent gain or loss of one or more repeat unit, creating alleles of different length (Ellegren 2004). However, imperfect microsatellites are often observed,
notably in shellfish where very high (>50) number of alleles per locus are often
reported (e.g. Huvet et al. 2004). For this reason, most SSR loci show high polymorphism and are extremely useful for the construction of genetic linkage maps
(Schlötterer 2004). Marine fish and shellfish species for which a genetic linkage map
is available were reviewed by Wenne et al. (2007). Most of these maps are based on
SSR loci, although in some cases AFLPs are used as well (e.g. sea bass, channel
catfish, mussel, flat oyster). As SSR loci were first characterized in non coding
regions, efforts have been made to identify and map SSRs with EST sequences
(EST-SSR). Recent efforts to generate ESTs in many marine species contribute to
M.L. Cancela et al.
EiD36
0.0
Id13
1.4
Hd46
4.2
LG21
-
0.0
RISP
640961.0
non_coding
1187937.0
cytoxidase_5A
4495254.0
Glyoxalase_I
5115217.0
CASC4
9051713.0
Ubiquitin_CTH_10
11101000.0
p22phox
11967303.0
non_coding
14461146.0
SPC18
15261512.0
Cyt_P450_19A1
18040624.0
non_coding
18439124.0
Transmprotein_208
18555030.0
GDP_f ucose_transporter_1
20617780.0
Sin3a
21393512.0
Cathepsin_D
21432464.0
ENSGACP00000022792
21512256.0
Cysteinyl_tRNA_synthetase
21567064.0
*
22105306.0
Chr II
Sapd01138
785.8
AF478569
714.1
Sapd01137
682.9
Sapd00677
605.3
Sapd00688
563.3
AJ418568
510.2
AJ418569
483.8
Sapd00311
458.5
AF399824
449.2
Sapd00582
442.9
Sapd00405
357.6
Sapd00110
341.5
Sapd00154
293.2
Sapd00681
253.1
Y17265
228.1
Sapd00087
169.6
Sapd00344
152.8
Hd46
140.8
Sapd00300
119.2
Sapd00146
56.8
Eid10
40.3
Sapd00377
36.5
Sapd01046
25.1
RH18
Fig. 7.2 Comparative mapping. RH18 (radiation hybrid group 18) from seabream radiation
hybrid map (Sarropoulou et al. 2007), LG21 (linkage group 21) from seabream genetic linkage
map (L. Bargelloni, unpublished data) and Chr II (chromosome II) from stickleback genome
(www.ensembl.org). Marker names on RH map correspond to unique transcripts from SAPD
database (identified with prefix Sapd), publicly available genes or SSR markers (identified with
GenBank accession numbers) and unpublished SSR markers (Eid10 and Hd46). Any PCRamplifiable sequence can be mapped onto the RH map (see text), allowing for a higher marker
density. On the other hand, only polymorphic SSR markers (Eid36, Id13 and Hd46) can be located
on the linkage map. In bold, the single SSR locus present in both maps. Correspondences between
individual seabream markers and putative homologues of seabream markers in stickleback genome
are shown. Several changes/errors in gene order between the two species are evident. (Figure credit:
L. Bargelloni)
a variable number of short repeats (2–6 nucleotides). SSRs are usually uniformly
distributed in genomes, at a relatively high frequency (1 every 1.5–6 kb) (Zane
et al. 2002, Chistiakov et al. 2006). The repetitive nature of the SSR core sequence
causes the frequent gain or loss of one or more repeat unit, creating alleles of different length (Ellegren 2004). However, imperfect microsatellites are often observed,
notably in shellfish where very high (>50) number of alleles per locus are often
reported (e.g. Huvet et al. 2004). For this reason, most SSR loci show high polymorphism and are extremely useful for the construction of genetic linkage maps
(Schlötterer 2004). Marine fish and shellfish species for which a genetic linkage map
is available were reviewed by Wenne et al. (2007). Most of these maps are based on
SSR loci, although in some cases AFLPs are used as well (e.g. sea bass, channel
catfish, mussel, flat oyster). As SSR loci were first characterized in non coding
regions, efforts have been made to identify and map SSRs with EST sequences
(EST-SSR). Recent efforts to generate ESTs in many marine species contribute to