

3.1 Introduction
Manganese comprises about 0.1% of the total mass of the Earth (Nealson 1983) and
occurs as MnAl 2 O 4 (Zajic 1969). It is the fifth most abundant transition metal in the
Earth’s crust (Tebo et al. 2007) and is the second most common trace metal after
iron (Tebo et al. 1997). The name manganese is derived from the Greek word
mangania, meaning magic (Horsburgh et al. 2002). It occupies the 25th position in
the periodic table and belongs to group VII transition elements (Cellier 2002). Mn
exist in seven different oxidation states ranging from 0 to +7 and in nature it occurs
in +II, +III, and +IV oxidation states (Tebo et al. 1997, 2004). Mn
2+ has an ionic
radius of 0.80 A
and has Gibbs standard energy of À54.5 DG
in aqueous solutions
(Hem 1978). It occurs at a concentration of 100–1000 ppm in river, 1–10 ppm in
ground water (Nealson 1983), and averages 8 mg kg
À1 in freshwater and 0.2 mg
kg
À1 in seawater (Bowen 1979 and Ehrlich 2002a). The concentration of dissolved
Mn (Mn
2+ ) in the open ocean ranges from 0.2–3 nmol kg
À1 of seawater (Glasby
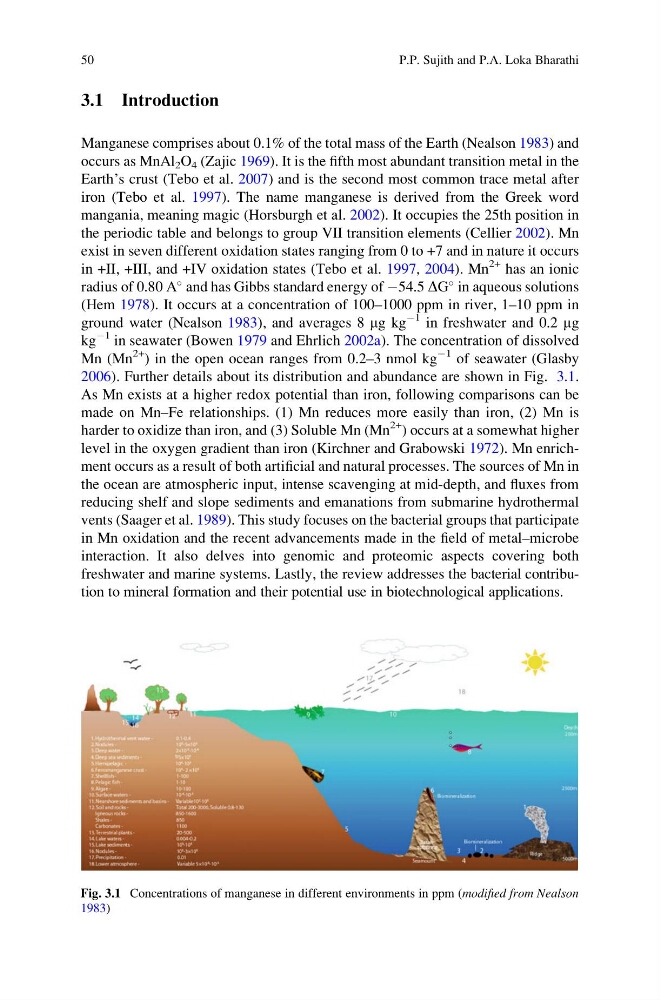
2006). Further details about its distribution and abundance are shown in Fig. 3.1.
As Mn exists at a higher redox potential than iron, following comparisons can be
made on Mn–Fe relationships. (1) Mn reduces more easily than iron, (2) Mn is
harder to oxidize than iron, and (3) Soluble Mn (Mn
2+ ) occurs at a somewhat higher
level in the oxygen gradient than iron (Kirchner and Grabowski 1972). Mn enrichment occurs as a result of both artificial and natural processes. The sources of Mn in
the ocean are atmospheric input, intense scavenging at mid-depth, and fluxes from
reducing shelf and slope sediments and emanations from submarine hydrothermal
vents (Saager et al. 1989). This study focuses on the bacterial groups that participate
in Mn oxidation and the recent advancements made in the field of metal–microbe
interaction. It also delves into genomic and proteomic aspects covering both
freshwater and marine systems. Lastly, the review addresses the bacterial contribution to mineral formation and their potential use in biotechnological applications.
Fig. 3.1 Concentrations of manganese in different environments in ppm (modified from Nealson
1983)
50
P.P. Sujith and P.A. Loka Bharathi
Manganese comprises about 0.1% of the total mass of the Earth (Nealson 1983) and
occurs as MnAl 2 O 4 (Zajic 1969). It is the fifth most abundant transition metal in the
Earth’s crust (Tebo et al. 2007) and is the second most common trace metal after
iron (Tebo et al. 1997). The name manganese is derived from the Greek word
mangania, meaning magic (Horsburgh et al. 2002). It occupies the 25th position in
the periodic table and belongs to group VII transition elements (Cellier 2002). Mn
exist in seven different oxidation states ranging from 0 to +7 and in nature it occurs
in +II, +III, and +IV oxidation states (Tebo et al. 1997, 2004). Mn
2+ has an ionic
radius of 0.80 A
and has Gibbs standard energy of À54.5 DG
in aqueous solutions
(Hem 1978). It occurs at a concentration of 100–1000 ppm in river, 1–10 ppm in
ground water (Nealson 1983), and averages 8 mg kg
À1 in freshwater and 0.2 mg
kg
À1 in seawater (Bowen 1979 and Ehrlich 2002a). The concentration of dissolved
Mn (Mn
2+ ) in the open ocean ranges from 0.2–3 nmol kg
À1 of seawater (Glasby
2006). Further details about its distribution and abundance are shown in Fig. 3.1.
As Mn exists at a higher redox potential than iron, following comparisons can be
made on Mn–Fe relationships. (1) Mn reduces more easily than iron, (2) Mn is
harder to oxidize than iron, and (3) Soluble Mn (Mn
2+ ) occurs at a somewhat higher
level in the oxygen gradient than iron (Kirchner and Grabowski 1972). Mn enrichment occurs as a result of both artificial and natural processes. The sources of Mn in
the ocean are atmospheric input, intense scavenging at mid-depth, and fluxes from
reducing shelf and slope sediments and emanations from submarine hydrothermal
vents (Saager et al. 1989). This study focuses on the bacterial groups that participate
in Mn oxidation and the recent advancements made in the field of metal–microbe
interaction. It also delves into genomic and proteomic aspects covering both
freshwater and marine systems. Lastly, the review addresses the bacterial contribution to mineral formation and their potential use in biotechnological applications.
Fig. 3.1 Concentrations of manganese in different environments in ppm (modified from Nealson
1983)
50
P.P. Sujith and P.A. Loka Bharathi