

66
Reef Environments
represented by its inert humic fraction. Thus'the data on its total stock could
be anyway hardly used directly for evaluations of the production of
dissolved organic matter and of involving it in the biological processes. This
situation induced attempts to measure just the labile part of its stock using
the BOD (biological oxygen demand) methodology. But even these data
appear to be difficult to interpret because the content of labile organic
matter in reef water is a result of the dynamic equilibrium of its production
and of its consumption - decomposition mostly by the bacterioplankton.
Therefore, it was important to estimate not only the stock (S), but also the
rate of at least one of these flows of labile organic matter. Measuring the
flow of its consumption (D), for example, and accepting a relatively stable
equilibrium of the above reciprocal processes, we can calculate its turnover
time T (T = SID), and evaluate the rate of release flow (Sorokin et al.
1983). In accordance with this method, the labile organic matter (LOM)
fraction is part of the total organic matter accessible to immediate microbial
action, calculated from the experimentally estimated decrease in oxygen in
bottled BOD samples after 20-30 days of exposure at to 20-25°C. During
this time, the BOD curve approaches plateau, thus showing the complete
exhaustion of the stock of labile organic matter. The calculations of stock of
LOM-carbon (S) account for the part consumed in the sample by bacteria
and protozoa for their growth (Sorokin et al. 1983). Special attention was
paid to the study of the production and the chemical composition of coral
mucus (Richman et al. 1975; Ducklow and Mitchell 1979b).
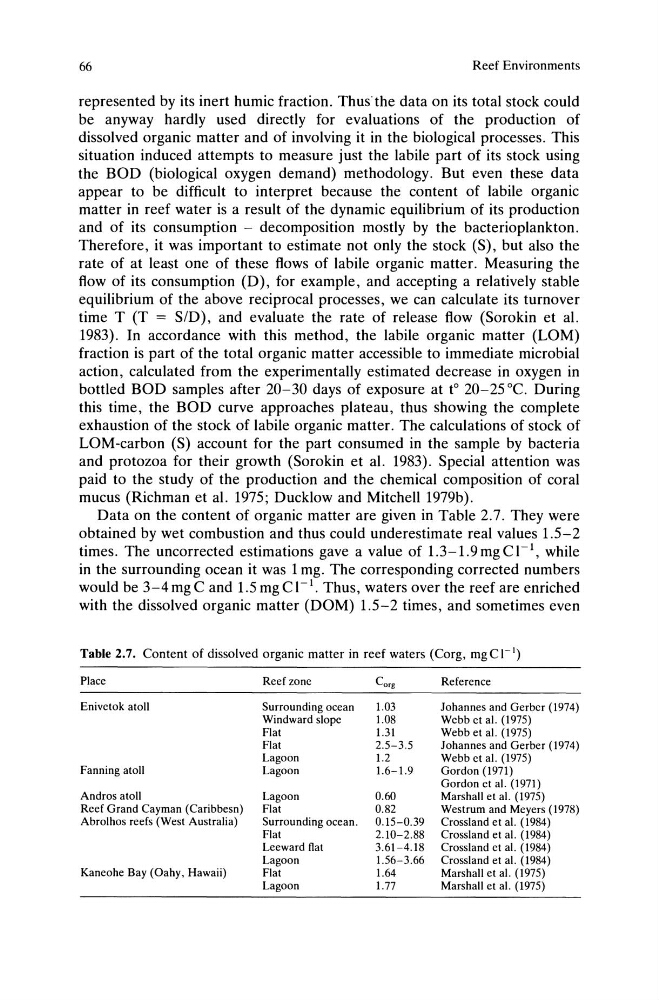
Data on the content of organic matter are given in Table 2.7. They were
obtained by wet combustion and thus could underestimate real values 1.5-2
times. The uncorrected estimations gave a value of 1.3-1.9mgCI- I , while
in the surrounding ocean it was 1 mg. The corresponding corrected numbers
would be 3-4 mg C and 1.5 mg C I-I. Thus, waters over the reef are enriched
with the dissolved organic matter (DOM) 1.5-2 times, and sometimes even
Table 2.7. Content of dissolved organic matter in reef waters (Corg, mg C I-I)
Place
Enivctok atoll
Fanning atoll
Andros atoll
Reef Grand Cayman (Caribbesn)
Abrolhos reefs (West Australia)
Kaneohe Bay (Oahy, Hawaii)
Reef zone
Surrounding ocean
Windward slope
Flat
Flat
Lagoon
Lagoon
Lagoon
Flat
Surrounding ocean.
Flat
Leeward lIat
Lagoon
Flat
Lagoon
Corg
Reference
1.03
Johannes and Gerber (1974)
1.08
Webb et al. (1975)
1.31
Webb et al. (1975)
2.5-3.5
Johannes and Gerber (1974)
1.2
Webb et al. (1975)
1.6-1.9
Gordon (1971)
Gordon et al. (1971)
0.60
Marshall et al. (1975)
0.82
Westrum and Meyers (1978)
0.15-0.39 Crossland et al. (1984)
2.10-2.88 Crossland et al. (1984)
3.61-4.18 Crossland et al. (1984)
1.56-3.66 Crossland et al. (1984)
1.64
Marshall et al. (1975)
1.77
Marshall et al. (1975)
Reef Environments
represented by its inert humic fraction. Thus'the data on its total stock could
be anyway hardly used directly for evaluations of the production of
dissolved organic matter and of involving it in the biological processes. This
situation induced attempts to measure just the labile part of its stock using
the BOD (biological oxygen demand) methodology. But even these data
appear to be difficult to interpret because the content of labile organic
matter in reef water is a result of the dynamic equilibrium of its production
and of its consumption - decomposition mostly by the bacterioplankton.
Therefore, it was important to estimate not only the stock (S), but also the
rate of at least one of these flows of labile organic matter. Measuring the
flow of its consumption (D), for example, and accepting a relatively stable
equilibrium of the above reciprocal processes, we can calculate its turnover
time T (T = SID), and evaluate the rate of release flow (Sorokin et al.
1983). In accordance with this method, the labile organic matter (LOM)
fraction is part of the total organic matter accessible to immediate microbial
action, calculated from the experimentally estimated decrease in oxygen in
bottled BOD samples after 20-30 days of exposure at to 20-25°C. During
this time, the BOD curve approaches plateau, thus showing the complete
exhaustion of the stock of labile organic matter. The calculations of stock of
LOM-carbon (S) account for the part consumed in the sample by bacteria
and protozoa for their growth (Sorokin et al. 1983). Special attention was
paid to the study of the production and the chemical composition of coral
mucus (Richman et al. 1975; Ducklow and Mitchell 1979b).
Data on the content of organic matter are given in Table 2.7. They were
obtained by wet combustion and thus could underestimate real values 1.5-2
times. The uncorrected estimations gave a value of 1.3-1.9mgCI- I , while
in the surrounding ocean it was 1 mg. The corresponding corrected numbers
would be 3-4 mg C and 1.5 mg C I-I. Thus, waters over the reef are enriched
with the dissolved organic matter (DOM) 1.5-2 times, and sometimes even
Table 2.7. Content of dissolved organic matter in reef waters (Corg, mg C I-I)
Place
Enivctok atoll
Fanning atoll
Andros atoll
Reef Grand Cayman (Caribbesn)
Abrolhos reefs (West Australia)
Kaneohe Bay (Oahy, Hawaii)
Reef zone
Surrounding ocean
Windward slope
Flat
Flat
Lagoon
Lagoon
Lagoon
Flat
Surrounding ocean.
Flat
Leeward lIat
Lagoon
Flat
Lagoon
Corg
Reference
1.03
Johannes and Gerber (1974)
1.08
Webb et al. (1975)
1.31
Webb et al. (1975)
2.5-3.5
Johannes and Gerber (1974)
1.2
Webb et al. (1975)
1.6-1.9
Gordon (1971)
Gordon et al. (1971)
0.60
Marshall et al. (1975)
0.82
Westrum and Meyers (1978)
0.15-0.39 Crossland et al. (1984)
2.10-2.88 Crossland et al. (1984)
3.61-4.18 Crossland et al. (1984)
1.56-3.66 Crossland et al. (1984)
1.64
Marshall et al. (1975)
1.77
Marshall et al. (1975)