

Nutrients
Ocean of the
I
Reef waters
I
leeward reef
63
Ocean off the
windward reef
I
I
L -__ -_-_-_----' 1_ - - - - - - - - - - - - - - - - - - - - - -I!::::-:=-===-=-1
I
Outflow,
accumulation
in bottom sediments
I
I
I
I
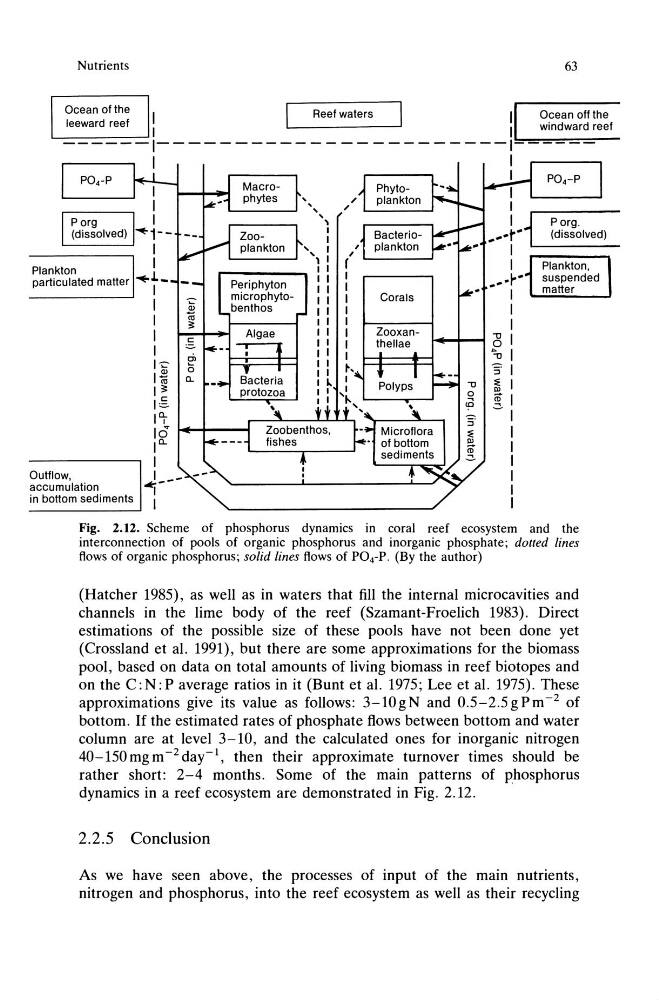
Fig. 2.12. Scheme of phosphorus dynamics in coral reef ecosystem and the
interconnection of pools of organic phosphorus and inorganic phosphate; dotted lines
flows of organic phosphorus; solid lines flows of P04-P. (By the author)
(Hatcher 1985), as well as in waters that fill the internal microcavities and
channels in the lime body of the reef (Szamant-Froelich 1983). Direct
estimations of the possible size of these pools have not been done yet
(Crossland et al. 1991), but there are some approximations for the biomass
pool, based on data on total amounts of living biomass in reef biotopes and
on the C: N: P average ratios in it (Bunt et al. 1975; Lee et ai. 1975). These
approximations give its value as follows: 3-lOgN and 0.5-2.5gPm- 2 of
bottom. If the estimated rates of phosphate flows between bottom and water
column are at level 3-10, and the calculated ones for inorganic nitrogen
40-150 mg m- 2 day-I, then their approximate turnover times should be
rather short: 2-4 months. Some of the main patterns of phosphorus
dynamics in a reef ecosystem are demonstrated in Fig. 2.12.
2.2.5 Conclusion
As we have seen above, the processes of input of the main nutrients,
nitrogen and phosphorus, into the reef ecosystem as well as their recycling
Ocean of the
I
Reef waters
I
leeward reef
63
Ocean off the
windward reef
I
I
L -__ -_-_-_----' 1_ - - - - - - - - - - - - - - - - - - - - - -I!::::-:=-===-=-1
I
Outflow,
accumulation
in bottom sediments
I
I
I
I
Fig. 2.12. Scheme of phosphorus dynamics in coral reef ecosystem and the
interconnection of pools of organic phosphorus and inorganic phosphate; dotted lines
flows of organic phosphorus; solid lines flows of P04-P. (By the author)
(Hatcher 1985), as well as in waters that fill the internal microcavities and
channels in the lime body of the reef (Szamant-Froelich 1983). Direct
estimations of the possible size of these pools have not been done yet
(Crossland et al. 1991), but there are some approximations for the biomass
pool, based on data on total amounts of living biomass in reef biotopes and
on the C: N: P average ratios in it (Bunt et al. 1975; Lee et ai. 1975). These
approximations give its value as follows: 3-lOgN and 0.5-2.5gPm- 2 of
bottom. If the estimated rates of phosphate flows between bottom and water
column are at level 3-10, and the calculated ones for inorganic nitrogen
40-150 mg m- 2 day-I, then their approximate turnover times should be
rather short: 2-4 months. Some of the main patterns of phosphorus
dynamics in a reef ecosystem are demonstrated in Fig. 2.12.
2.2.5 Conclusion
As we have seen above, the processes of input of the main nutrients,
nitrogen and phosphorus, into the reef ecosystem as well as their recycling