

Model Studies and Energy Budget in Reef Ecosystems
Sharks, large predatory fish
PIB = 0,4
P=0,002
Seals and birds
PIB=3,0
P=0,003
Phytoplankton
PIB=70
P=2,3
387
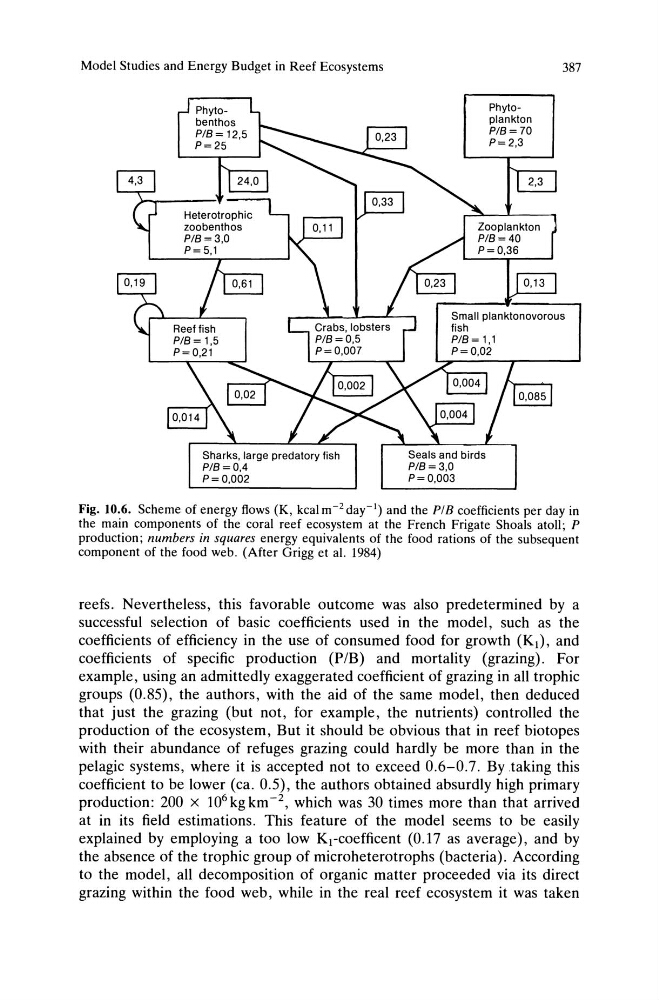
Fig. 10.6. Scheme of energy flows (K, kcal m- 2 day-l) and the PIB coefficients per day in
the main components of the coral reef ecosystem at the French Frigate Shoals atoll; P
production; numbers in squares energy equivalents of the food rations of the subsequent
component of the food web. (After Grigg et al. 1984)
reefs. Nevertheless, this favorable outcome was also predetermined by a
successful selection of basic coefficients used in the model, such as the
coefficients of efficiency in the use of consumed food for growth (K]), and
coefficients of specific production (P/B) and mortality (grazing). For
example, using an admittedly exaggerated coefficient of grazing in all trophic
groups (0.85), the authors, with the aid of the same model, then deduced
that just the grazing (but not, for example, the nutrients) controlled the
production of the ecosystem, But it should be obvious that in reef biotopes
with their abundance of refuges grazing could hardly be more than in the
pelagic systems, where it is accepted not to exceed 0.6-0.7. By.taking this
coefficient to be lower (ca. 0.5), the authors obtained absurdly high primary
production: 200 X 10 6 kg km -2, which was 30 times more than that arrived
at in its field estimations. This feature of the model seems to be easily
explained by employing a too low Krcoefficent (0.17 as average), and by
the absence of the trophic group of microheterotrophs (bacteria). According
to the model, all decomposition of organic matter proceeded via its direct
grazing within the food web, while in the real reef ecosystem it was taken
Sharks, large predatory fish
PIB = 0,4
P=0,002
Seals and birds
PIB=3,0
P=0,003
Phytoplankton
PIB=70
P=2,3
387
Fig. 10.6. Scheme of energy flows (K, kcal m- 2 day-l) and the PIB coefficients per day in
the main components of the coral reef ecosystem at the French Frigate Shoals atoll; P
production; numbers in squares energy equivalents of the food rations of the subsequent
component of the food web. (After Grigg et al. 1984)
reefs. Nevertheless, this favorable outcome was also predetermined by a
successful selection of basic coefficients used in the model, such as the
coefficients of efficiency in the use of consumed food for growth (K]), and
coefficients of specific production (P/B) and mortality (grazing). For
example, using an admittedly exaggerated coefficient of grazing in all trophic
groups (0.85), the authors, with the aid of the same model, then deduced
that just the grazing (but not, for example, the nutrients) controlled the
production of the ecosystem, But it should be obvious that in reef biotopes
with their abundance of refuges grazing could hardly be more than in the
pelagic systems, where it is accepted not to exceed 0.6-0.7. By.taking this
coefficient to be lower (ca. 0.5), the authors obtained absurdly high primary
production: 200 X 10 6 kg km -2, which was 30 times more than that arrived
at in its field estimations. This feature of the model seems to be easily
explained by employing a too low Krcoefficent (0.17 as average), and by
the absence of the trophic group of microheterotrophs (bacteria). According
to the model, all decomposition of organic matter proceeded via its direct
grazing within the food web, while in the real reef ecosystem it was taken