

378
Biogeochemical Metabolism and Energy Flows in Reef Ecosystems
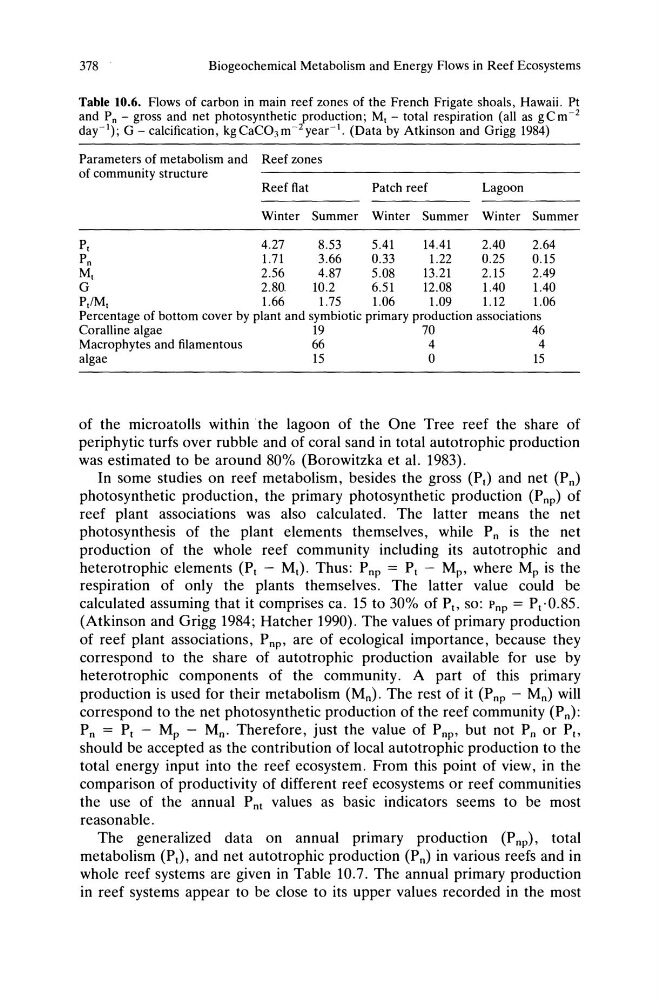
Table 10.6. Flows of carbon in main reef zones of the French Frigate shoals, Hawaii. Pt
and Pn - gross and net photosynthetic production; M, - total respiration (all as gCm- 2
day-I); G - calcification, kgCaC03 m- 2 year- l . (Data by Atkinson and Grigg 1984)
Parameters of metabolism and Reef zones
of community structure
Reef flat
Patch reef
Lagoon
Winter Summer Winter Summer Winter Summer
P,
4.27
8.53
5.41
14.41
2.40
2.64
P n
1.71
3.66
0.33
1.22
0.25
0.15
M,
2.56
4.87
5.08
13.21
2.15
2.49
G
2.80
10.2
6.51
12.08
1.40
1.40
P,/M,
1.66
1.75
1.06
1.09
1.12
1.06
Percentage of bottom cover by plant and symbiotic primary production associations
Coralline algae
19
70
46
Macrophytes and filamentous
66
4
4
algae
15
0
15
of the microatolls within the lagoon of the One Tree reef the share of
periphytic turfs over rubble and of coral sand in total autotrophic production
was estimated to be around 80% (Borowitzka et al. 1983).
In some studies on reef metabolism, besides the gross (PI) and net (P n)
photosynthetic production, the primary photosynthetic production (P np) of
reef plant associations was also calculated. The latter means the net
photosynthesis of the plant elements themselves, while P n is the net
production of the whole reef community including its autotrophic and
heterotrophic elements (PI - MI). Thus: Pnp = PI - Mp, where Mp is the
respiration of only the plants themselves. The latter value could be
calculated assuming that it comprises ca. 15 to 30% of PI' so: Pnp = PI·0.8S.
(Atkinson and Grigg 1984; Hatcher 1990). The values of primary production
of reef plant associations, P np' are of ecological importance, because they
correspond to the share of autotrophic production available for use by
heterotrophic components of the community. A part of this primary
production is used for their metabolism (Mn). The rest of it (P np - Mn) will
correspond to the net photosynthetic production of the reef community (P n):
P n = PI - Mp - Mn. Therefore, just the value of P np' but not P n or P"
should be accepted as the contribution of local autotrophic production to the
total energy input into the reef ecosystem. From this point of view, in the
comparison of productivity of different reef ecosystems or reef communities
the use of the annual P nl values as basic indicators seems to be most
reasonable.
The generalized data on annual primary production (P np), total
metabolism (PI), and net autotrophic production (P n) in various reefs and in
whole reef systems are given in Table 10.7. The annual primary production
in reef systems appear to be close to its upper values recorded in the most
Biogeochemical Metabolism and Energy Flows in Reef Ecosystems
Table 10.6. Flows of carbon in main reef zones of the French Frigate shoals, Hawaii. Pt
and Pn - gross and net photosynthetic production; M, - total respiration (all as gCm- 2
day-I); G - calcification, kgCaC03 m- 2 year- l . (Data by Atkinson and Grigg 1984)
Parameters of metabolism and Reef zones
of community structure
Reef flat
Patch reef
Lagoon
Winter Summer Winter Summer Winter Summer
P,
4.27
8.53
5.41
14.41
2.40
2.64
P n
1.71
3.66
0.33
1.22
0.25
0.15
M,
2.56
4.87
5.08
13.21
2.15
2.49
G
2.80
10.2
6.51
12.08
1.40
1.40
P,/M,
1.66
1.75
1.06
1.09
1.12
1.06
Percentage of bottom cover by plant and symbiotic primary production associations
Coralline algae
19
70
46
Macrophytes and filamentous
66
4
4
algae
15
0
15
of the microatolls within the lagoon of the One Tree reef the share of
periphytic turfs over rubble and of coral sand in total autotrophic production
was estimated to be around 80% (Borowitzka et al. 1983).
In some studies on reef metabolism, besides the gross (PI) and net (P n)
photosynthetic production, the primary photosynthetic production (P np) of
reef plant associations was also calculated. The latter means the net
photosynthesis of the plant elements themselves, while P n is the net
production of the whole reef community including its autotrophic and
heterotrophic elements (PI - MI). Thus: Pnp = PI - Mp, where Mp is the
respiration of only the plants themselves. The latter value could be
calculated assuming that it comprises ca. 15 to 30% of PI' so: Pnp = PI·0.8S.
(Atkinson and Grigg 1984; Hatcher 1990). The values of primary production
of reef plant associations, P np' are of ecological importance, because they
correspond to the share of autotrophic production available for use by
heterotrophic components of the community. A part of this primary
production is used for their metabolism (Mn). The rest of it (P np - Mn) will
correspond to the net photosynthetic production of the reef community (P n):
P n = PI - Mp - Mn. Therefore, just the value of P np' but not P n or P"
should be accepted as the contribution of local autotrophic production to the
total energy input into the reef ecosystem. From this point of view, in the
comparison of productivity of different reef ecosystems or reef communities
the use of the annual P nl values as basic indicators seems to be most
reasonable.
The generalized data on annual primary production (P np), total
metabolism (PI), and net autotrophic production (P n) in various reefs and in
whole reef systems are given in Table 10.7. The annual primary production
in reef systems appear to be close to its upper values recorded in the most