

376
Biogeochemical Metabolism and Energy Flows in Reef Ecosystems
macrophytes 30 g (Gordon and Kelley 1962; Connor and Adey 1977; Griffith
et al. 1987). The largest Pt values (1O-20gCm- 2 dayI-2) were recorded in
zones of flourishing ramose coral 'associations in submerged leeward patch
reefs and on outer reef slope with relatively low turbulence. Its high values
(7 - 20 g C) are peculiar also to biotopes dominated by macrophytes, algal
turfs, and seagrasses. In biotopes of submerged reef flat covered by mixed
communities of corals, corallines, macrophytes, and turfs of filamentous
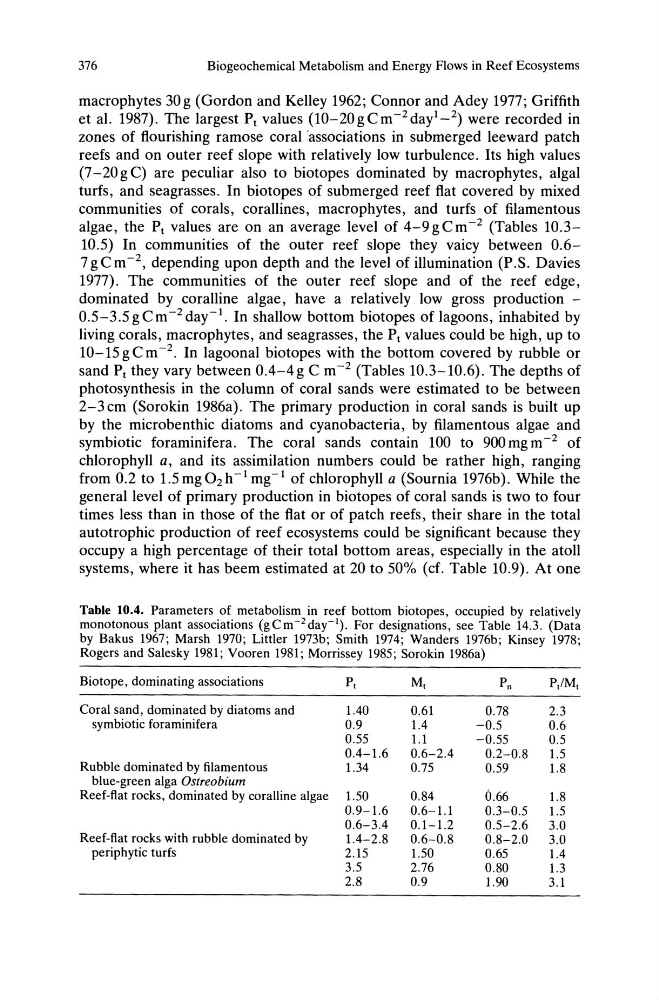
algae, the PI values are on an average level of 4-9 g C m -2 (Tables 10.310.5) In communities of the outer reef slope they vaicy between 0.67 g C m -2, depending upon depth and the level of illumination (P .S. Davies
1977). The communities of the outer reef slope and of the reef edge,
dominated by coralline algae, have a relatively low gross production -
0.5-3.5 g C m -2 day-I. In shallow bottom biotopes of lagoons, inhabited by
living corals, macrophytes, and seagrasses, the PI values could be high, up to
10-15 g C m -2. In lagoonal biotopes with the bottom covered by rubble or
sand PI they vary between 0.4-4g C m- 2 (Tables 10.3-10.6). The depths of
photosynthesis in the column of coral sands were estimated to be between
2-3 cm (Sorokin 1986a). The primary production in coral sands is built up
by the microbenthic diatoms and cyanobacteria, by filamentous algae and
symbiotic foraminifera. The coral sands contain 100 to 900 mg m -2 of
chlorophyll a, and its assimilation numbers could be rather high, ranging
from 0.2 to 1.5mg02h-Img-I of chlorophyll a (Sournia 1976b). While the
general level of primary production in biotopes of coral sands is two to four
times less than in those of the flat or of patch reefs, their share in the total
autotrophic production of reef ecosystems could be significant because they
occupy a high percentage of their total bottom areas, especially in the atoll
systems, where it has beem estimated at 20 to 50% (d. Table 10.9). At one
Table 10.4. Parameters of metabolism in reef bottom biotopes, occupied by relatively
monotonous plant associations (gCm- 2 day-l). For designations, see Table 14.3. (Data
by Bakus 1967; Marsh 1970; Littler 1973b; Smith 1974; Wanders 1976b; Kinsey 1978;
Rogers and Salesky 1981; Vooren 1981; Morrissey 1985; Sorokin 1986a)
Biotope, dominating associations
Pt
Mt
Pn
P,IMt
Coral sand, dominated by diatoms and
1.40
0.61
0.78
2.3
symbiotic foraminifera
0.9
1.4
-0.5
0.6
0.55
1.1
-0.55
0.5
0.4-1.6
0.6-2.4
0.2-0.8
1.5
Rubble dominated by filamentous
1.34
0.75
0.59
1.8
blue-green alga Ostreobium
Reef-flat rocks, dominated by coralline algae 1.50
0.84
0.66
1.8
0.9-1.6
0.6-1.1
0.3-0.5
1.5
0.6-3.4
0.1-1.2
0.5-2,6
3.0
Reef-flat rocks with rubble dominated by
1.4-2.8
0.6-0.8
0.8-2.0
3.0
periphytic turfs
2.15
1.50
0.65
1.4
3.5
2.76
0.80
1.3
2.8
0.9
1.90
3.1
Biogeochemical Metabolism and Energy Flows in Reef Ecosystems
macrophytes 30 g (Gordon and Kelley 1962; Connor and Adey 1977; Griffith
et al. 1987). The largest Pt values (1O-20gCm- 2 dayI-2) were recorded in
zones of flourishing ramose coral 'associations in submerged leeward patch
reefs and on outer reef slope with relatively low turbulence. Its high values
(7 - 20 g C) are peculiar also to biotopes dominated by macrophytes, algal
turfs, and seagrasses. In biotopes of submerged reef flat covered by mixed
communities of corals, corallines, macrophytes, and turfs of filamentous
algae, the PI values are on an average level of 4-9 g C m -2 (Tables 10.310.5) In communities of the outer reef slope they vaicy between 0.67 g C m -2, depending upon depth and the level of illumination (P .S. Davies
1977). The communities of the outer reef slope and of the reef edge,
dominated by coralline algae, have a relatively low gross production -
0.5-3.5 g C m -2 day-I. In shallow bottom biotopes of lagoons, inhabited by
living corals, macrophytes, and seagrasses, the PI values could be high, up to
10-15 g C m -2. In lagoonal biotopes with the bottom covered by rubble or
sand PI they vary between 0.4-4g C m- 2 (Tables 10.3-10.6). The depths of
photosynthesis in the column of coral sands were estimated to be between
2-3 cm (Sorokin 1986a). The primary production in coral sands is built up
by the microbenthic diatoms and cyanobacteria, by filamentous algae and
symbiotic foraminifera. The coral sands contain 100 to 900 mg m -2 of
chlorophyll a, and its assimilation numbers could be rather high, ranging
from 0.2 to 1.5mg02h-Img-I of chlorophyll a (Sournia 1976b). While the
general level of primary production in biotopes of coral sands is two to four
times less than in those of the flat or of patch reefs, their share in the total
autotrophic production of reef ecosystems could be significant because they
occupy a high percentage of their total bottom areas, especially in the atoll
systems, where it has beem estimated at 20 to 50% (d. Table 10.9). At one
Table 10.4. Parameters of metabolism in reef bottom biotopes, occupied by relatively
monotonous plant associations (gCm- 2 day-l). For designations, see Table 14.3. (Data
by Bakus 1967; Marsh 1970; Littler 1973b; Smith 1974; Wanders 1976b; Kinsey 1978;
Rogers and Salesky 1981; Vooren 1981; Morrissey 1985; Sorokin 1986a)
Biotope, dominating associations
Pt
Mt
Pn
P,IMt
Coral sand, dominated by diatoms and
1.40
0.61
0.78
2.3
symbiotic foraminifera
0.9
1.4
-0.5
0.6
0.55
1.1
-0.55
0.5
0.4-1.6
0.6-2.4
0.2-0.8
1.5
Rubble dominated by filamentous
1.34
0.75
0.59
1.8
blue-green alga Ostreobium
Reef-flat rocks, dominated by coralline algae 1.50
0.84
0.66
1.8
0.9-1.6
0.6-1.1
0.3-0.5
1.5
0.6-3.4
0.1-1.2
0.5-2,6
3.0
Reef-flat rocks with rubble dominated by
1.4-2.8
0.6-0.8
0.8-2.0
3.0
periphytic turfs
2.15
1.50
0.65
1.4
3.5
2.76
0.80
1.3
2.8
0.9
1.90
3.1