

Energy Balance and Specific Growth Rate of Corals
367
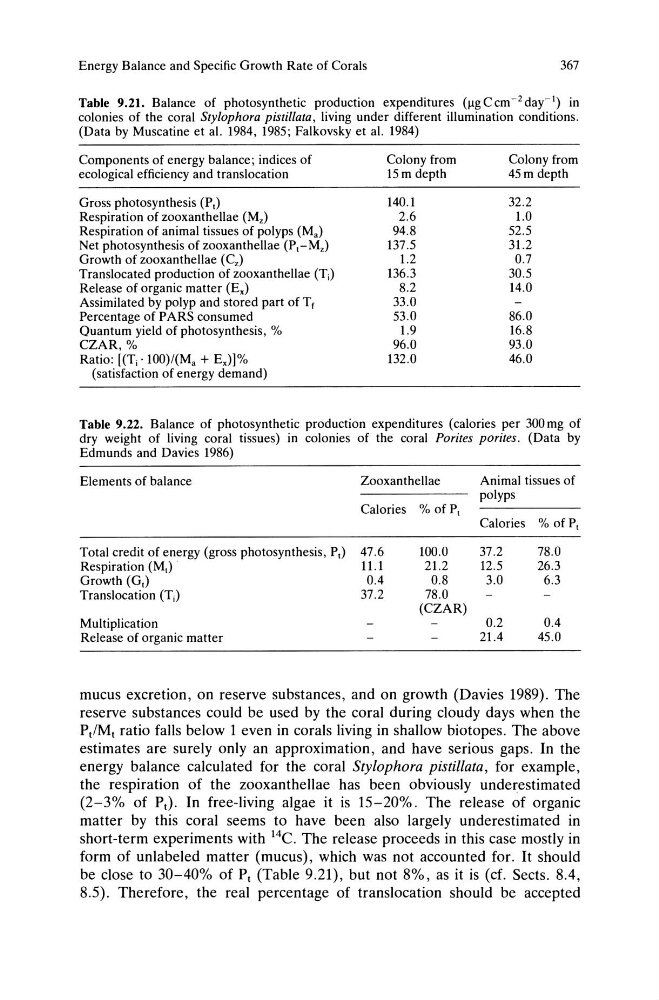
Table 9.21. Balance of photosynthetic production expenditures (Ilg C cm- 2 day-I) in
colonies of the coral Stylophora pistillata, living under different illumination conditions.
(Data by Muscatine et al. 1984, 1985; Falkovsky et al. 1984)
Components of energy balance; indices of
ecological efficiency and translocation
Gross photosynthesis (P,)
Respiration of zooxanthellae (Mz)
Respiration of animal tissues of polyps (Ma)
Net photosynthesis of zooxanthellae (P,-Mz)
Growth of zooxanthellae (Cz)
Translocated production of zooxanthellae (Tj )
Release of organic matter (Ex)
Assimilated by polyp and stored part of Tf
Percentage of PARS consumed
Quantum yield of photosynthesis, %
CZAR, %
Ratio: [(Tj • 100)/(Ma + Ex)]%
(satisfaction of energy demand)
Colony from
15 m depth
140.1
2.6
94.8
137.5
1.2
136.3
8.2
33.0
53.0
1.9
96.0
132.0
Colony from
45 m depth
32.2
1.0
52.5
31.2
0.7
30.5
14.0
86.0
16.8
93.0
46.0
Table 9.22. Balance of photosynthetic production expenditures (calories per 300 mg of
dry weight of living coral tissues) in colonies of the coral Porites porites. (Data by
Edmunds and Davies 1986)
Elements of balance
Zooxanthellae
Animal tissues of
polyps
Calories % ofP,
Calories % ofP,
Total credit of energy (gross photosynthesis, PI) 47.6
100.0
37.2
78.0
Respiration (M,) .
11.1
21.2
12.5
26.3
Growth (G,)
0.4
0.8
3.0
6.3
Translocation (Tj )
37.2
78.0
(CZAR)
Multiplication
0.2
0.4
Release of organic matter
21.4
45.0
mucus excretion, on reserve substances, and on growth (Davies 1989). The
reserve substances could be used by the coral during cloudy days when the
Pt/Mt ratio falls below 1 even in corals living in shallow biotopes. The above
estimates are surely only an approximation, and have serious gaps. In the
energy balance calculated for the coral Stylophora pistil/ata, for example,
the respiration of the zooxanthellae has been obviously underestimated
(2-3% of Pt). In free-living algae it is 15-20%. The release of organic
matter by this coral seems to have been also largely underestimated in
short-term experiments with 14c. The release proceeds in this case mostly in
form of unlabeled matter (mucus), which was not accounted for. It should
be close to 30-40% of Pt (Table 9.21), but not 8%, as it is (ct. Sects. 8.4,
8.5). Therefore, the real percentage of translocation should be accepted
367
Table 9.21. Balance of photosynthetic production expenditures (Ilg C cm- 2 day-I) in
colonies of the coral Stylophora pistillata, living under different illumination conditions.
(Data by Muscatine et al. 1984, 1985; Falkovsky et al. 1984)
Components of energy balance; indices of
ecological efficiency and translocation
Gross photosynthesis (P,)
Respiration of zooxanthellae (Mz)
Respiration of animal tissues of polyps (Ma)
Net photosynthesis of zooxanthellae (P,-Mz)
Growth of zooxanthellae (Cz)
Translocated production of zooxanthellae (Tj )
Release of organic matter (Ex)
Assimilated by polyp and stored part of Tf
Percentage of PARS consumed
Quantum yield of photosynthesis, %
CZAR, %
Ratio: [(Tj • 100)/(Ma + Ex)]%
(satisfaction of energy demand)
Colony from
15 m depth
140.1
2.6
94.8
137.5
1.2
136.3
8.2
33.0
53.0
1.9
96.0
132.0
Colony from
45 m depth
32.2
1.0
52.5
31.2
0.7
30.5
14.0
86.0
16.8
93.0
46.0
Table 9.22. Balance of photosynthetic production expenditures (calories per 300 mg of
dry weight of living coral tissues) in colonies of the coral Porites porites. (Data by
Edmunds and Davies 1986)
Elements of balance
Zooxanthellae
Animal tissues of
polyps
Calories % ofP,
Calories % ofP,
Total credit of energy (gross photosynthesis, PI) 47.6
100.0
37.2
78.0
Respiration (M,) .
11.1
21.2
12.5
26.3
Growth (G,)
0.4
0.8
3.0
6.3
Translocation (Tj )
37.2
78.0
(CZAR)
Multiplication
0.2
0.4
Release of organic matter
21.4
45.0
mucus excretion, on reserve substances, and on growth (Davies 1989). The
reserve substances could be used by the coral during cloudy days when the
Pt/Mt ratio falls below 1 even in corals living in shallow biotopes. The above
estimates are surely only an approximation, and have serious gaps. In the
energy balance calculated for the coral Stylophora pistil/ata, for example,
the respiration of the zooxanthellae has been obviously underestimated
(2-3% of Pt). In free-living algae it is 15-20%. The release of organic
matter by this coral seems to have been also largely underestimated in
short-term experiments with 14c. The release proceeds in this case mostly in
form of unlabeled matter (mucus), which was not accounted for. It should
be close to 30-40% of Pt (Table 9.21), but not 8%, as it is (ct. Sects. 8.4,
8.5). Therefore, the real percentage of translocation should be accepted