

Autotrophic Feeding of Corals
333
200-260 Ilg C day-I, their gross photosynthetic production should be about
12-15 g Cm- 2 day-l.
In the octocorals the values of photosynthesis calculated per gram of dry
weight of their colonies were two to ten times more than in scleractinians
(0.6-3mgCday-l), while per gram wet weight they were comparable
(Tables 9.5, 9.6). This happens because their colonies contain much water
and less hard skeletal material than those of scleractinians. The largest
values of P t were recorded in Zoanthus sociatus: 4.85mgCg- l day-l
(Tables 9.6,9.9). Calculated per gram C of polyp tissues, in the scleractinian
corals the Pt values ranged from 1.1 to 4.5mgCday-l, and only in the coral
Seriatopora histrix was it 8 mg C. The highest values were recorded in small
polyps, which have a large, specific surface area.
The net photosynthesis (P n), which is equal to the difference between
gross production and respiration (P t - Mt), in most corals ranges at optimal
illumination from 30 to 100 Ilg C g-l day-I, or 20 to 50% of Pt. It was largest
in ramose and foliose corals (Table 9.4). In most corals at the upper reef
zone the P n-values calculated per m 2 of active colony surface appeared to be
significant: 150-200mgCday-\ while in the coral Turbinaria reniformis it
was even up to 850mgC (Rogers and Salesky 1981; Falkovsky et al. 1984).
The efficiency of utilization of light energy by corals at the above values of
Pt in well-illuminated reef zones ranges from 0.5 to 2.5% (Beyers 1966),
increasing in more shaded or deep biotopes to 5 -10% (Gattuso 1985;
Muscatine et al. 1985). Because of the corals' ability for light adaptation
their photosynthesis remains relatively constant within a wide scale of light
intensities - up to one order of their values (cf. Sect. 8.4). In Table 9.9 an
example is given of Pt in corals at the surface and at depths of 20-30m. It
shows that in some of their species the photosynthesis rate could be even
higher under moderate than under strong light (Taylor 1973; Wethey and
Porter 1976).
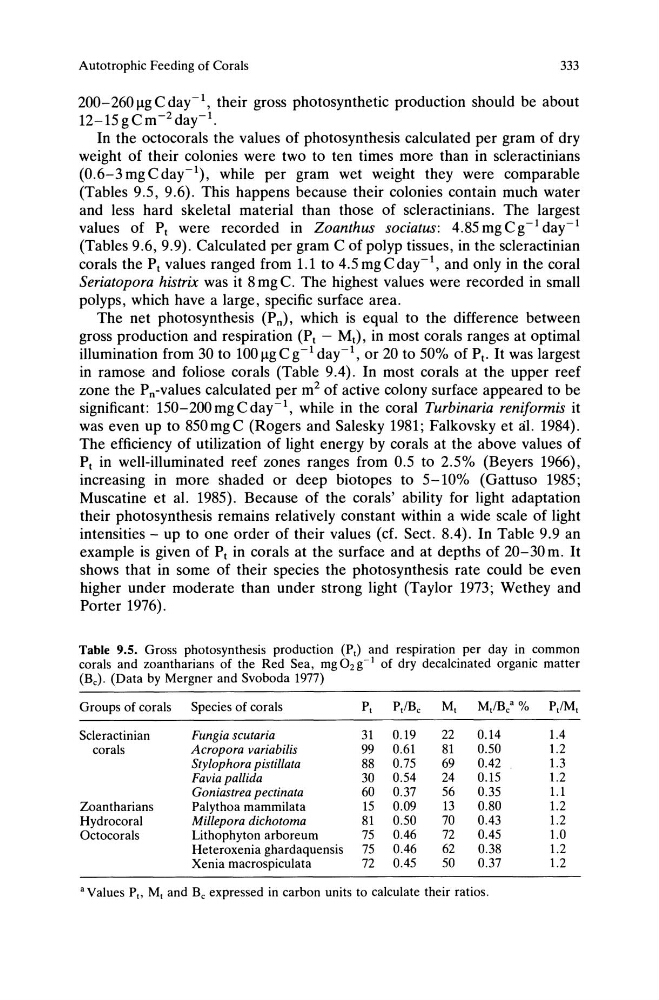
Table 9.5. Gross photosynthesis production (P,) and respiration per day in common
corals and zoantharians of the Red Sea, mg O2 g-l of dry decalcinated organic matter
(Be). (Data by Mergner and Svoboda 1977)
Groups of corals
Species of corals
P,
P,IBe
M,
M,IBe a %
P,IM,
Scleractinian
Fungia scutaria
31 0.19
22
0.14
1.4
corals
Acropora variabilis
99 0.61
81
0.50
1.2
Stylophora pistil/ata
88 0.75
69
0.42
1.3
Favia pallida
30 0.54
24
0.15
1.2
Goniastrea pectinata
60 0.37
56
0.35
1.1
Zoantharians
Palythoa mammilata
15 0.09
13
0.80
1.2
Hydrocoral
Mil/epora dichotoma
81
0.50
70
0.43
1.2
Octocorals
Lithophyton arboreum
75 0.46
72
0.45
1.0
Heteroxenia ghardaquensis 75 0.46
62
0.38
1.2
Xenia macrospiculata
72 0.45
50
0.37
1.2
a Values P" M, and Be expressed in carbon units to calculate their ratios.
333
200-260 Ilg C day-I, their gross photosynthetic production should be about
12-15 g Cm- 2 day-l.
In the octocorals the values of photosynthesis calculated per gram of dry
weight of their colonies were two to ten times more than in scleractinians
(0.6-3mgCday-l), while per gram wet weight they were comparable
(Tables 9.5, 9.6). This happens because their colonies contain much water
and less hard skeletal material than those of scleractinians. The largest
values of P t were recorded in Zoanthus sociatus: 4.85mgCg- l day-l
(Tables 9.6,9.9). Calculated per gram C of polyp tissues, in the scleractinian
corals the Pt values ranged from 1.1 to 4.5mgCday-l, and only in the coral
Seriatopora histrix was it 8 mg C. The highest values were recorded in small
polyps, which have a large, specific surface area.
The net photosynthesis (P n), which is equal to the difference between
gross production and respiration (P t - Mt), in most corals ranges at optimal
illumination from 30 to 100 Ilg C g-l day-I, or 20 to 50% of Pt. It was largest
in ramose and foliose corals (Table 9.4). In most corals at the upper reef
zone the P n-values calculated per m 2 of active colony surface appeared to be
significant: 150-200mgCday-\ while in the coral Turbinaria reniformis it
was even up to 850mgC (Rogers and Salesky 1981; Falkovsky et al. 1984).
The efficiency of utilization of light energy by corals at the above values of
Pt in well-illuminated reef zones ranges from 0.5 to 2.5% (Beyers 1966),
increasing in more shaded or deep biotopes to 5 -10% (Gattuso 1985;
Muscatine et al. 1985). Because of the corals' ability for light adaptation
their photosynthesis remains relatively constant within a wide scale of light
intensities - up to one order of their values (cf. Sect. 8.4). In Table 9.9 an
example is given of Pt in corals at the surface and at depths of 20-30m. It
shows that in some of their species the photosynthesis rate could be even
higher under moderate than under strong light (Taylor 1973; Wethey and
Porter 1976).
Table 9.5. Gross photosynthesis production (P,) and respiration per day in common
corals and zoantharians of the Red Sea, mg O2 g-l of dry decalcinated organic matter
(Be). (Data by Mergner and Svoboda 1977)
Groups of corals
Species of corals
P,
P,IBe
M,
M,IBe a %
P,IM,
Scleractinian
Fungia scutaria
31 0.19
22
0.14
1.4
corals
Acropora variabilis
99 0.61
81
0.50
1.2
Stylophora pistil/ata
88 0.75
69
0.42
1.3
Favia pallida
30 0.54
24
0.15
1.2
Goniastrea pectinata
60 0.37
56
0.35
1.1
Zoantharians
Palythoa mammilata
15 0.09
13
0.80
1.2
Hydrocoral
Mil/epora dichotoma
81
0.50
70
0.43
1.2
Octocorals
Lithophyton arboreum
75 0.46
72
0.45
1.0
Heteroxenia ghardaquensis 75 0.46
62
0.38
1.2
Xenia macrospiculata
72 0.45
50
0.37
1.2
a Values P" M, and Be expressed in carbon units to calculate their ratios.