

330
Nutrition of Corals
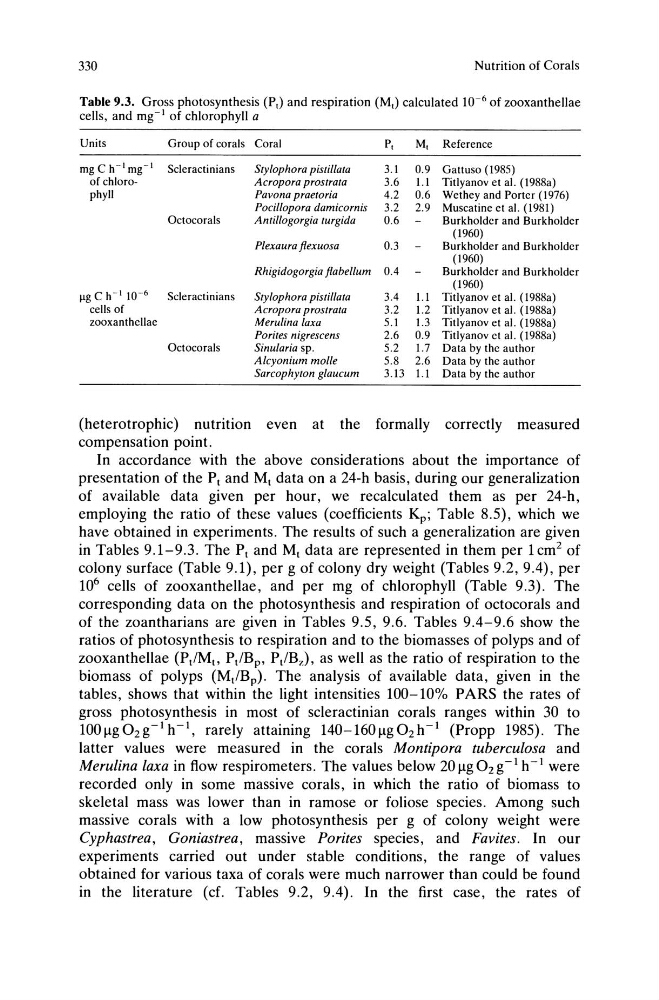
Table 9.3. Gross photosynthesis (P,) and respiration (M,) calculated 10- 6 of zooxanthellae
cells, and mg- 1 of chlorophyll a
Units
Group of corals Coral
P,
M, Reference
mg C h- 1 mg- 1 Scleractinians
Stylophora pistillata
3.1
0.9 Gattuso (1985)
of chloroAcropora prostrata
3.6 1.1 Titlyanov et al. (1988a)
phyll
Pavona praetoria
4.2 0.6 Wethey and Porter (1976)
Pocillopora damicornis 3.2 2.9 Muscatine et al. (1981)
Octocorals
Antillogorgia turgida
0.6
Burkholder and Burkholder
(1960)
Plexaura flexuosa
0.3
Burkholder and Burkholder
(1960)
Rhigidogorgia flabellum 0.4
Burkholdcr and Burkholder
~g C h- 1 10- 6
Scleractinians
Stylophora pistillata
3.4
(1960)
1.1 Titlyanov et al. (1988a)
cells of
Acropora prostrata
3.2
1.2 Titlyanov et al. (1988a)
zooxanthellae
Merulina laxa
5.1
1.3 Titlyanov et al. (1988a)
Porites nigrescens
2.6 0.9 Titlyanov ct al. (1988a)
Octocorals
Sinularia sp.
5.2
1.7 Data by the author
Alcyonium molle
5.8 2.6 Data by the author
Sarcophyton glaucum
3.13 1.1 Data by the author
(heterotrophic) nutrition even at the formally correctly measured
compensation point.
In accordance with the above considerations about the importance of
presentation of the Pt and Mt data on a 24-h basis, during our generalization
of available data given per hour, we recalculated them as per 24-h,
employing the ratio of these values (coefficients Kp; Table 8.5), which we
have obtained in experiments. The results of such a generalization are given
in Tables 9.1-9.3. The Pt and Mt data are represented in them per 1cm 2 of
colony surface (Table 9.1), per g of colony dry weight (Tables 9.2,9.4), per
10 6 cells of zooxanthellae, and per mg of chlorophyll (Table 9.3). The
corresponding data on the photosynthesis and respiration of octocorals and
of the zoantharians are given in Tables 9.5, 9.6. Tables 9.4-9.6 show the
ratios of photosynthesis to respiration and to the biomasses of polyps and of
zooxanthellae (P/Mt, PtlBp, Pt/Bz ), as well as the ratio of respiration to the
biomass of polyps (Mt/B p ). The analysis of available data, given in the
tables, shows that within the light intensities 100-10% PARS the rates of
gross photosynthesis in most of scleractinian corals ranges within 30 to
10011g02g-lh-l, rarely attaining 140-16011g02h-1 (Propp 1985). The
latter values were measured in the corals Montipora tuberculosa and
Merulina laxa in flow respirometers. The values below 20 llg O2 g -I h -1 were
recorded only in some massive corals, in which the ratio of biomass to
skeletal mass was lower than in ramose or foliose species. Among such
massive corals with a low photosynthesis per g of colony weight were
Cyphastrea, Goniastrea, massive Porites species, and Favites. In our
experiments carried out under stable conditions, the range of values
obtained for various taxa of corals were much narrower than could be found
in the literature (cf. Tables 9.2, 9.4). In the first case, the rates of
Nutrition of Corals
Table 9.3. Gross photosynthesis (P,) and respiration (M,) calculated 10- 6 of zooxanthellae
cells, and mg- 1 of chlorophyll a
Units
Group of corals Coral
P,
M, Reference
mg C h- 1 mg- 1 Scleractinians
Stylophora pistillata
3.1
0.9 Gattuso (1985)
of chloroAcropora prostrata
3.6 1.1 Titlyanov et al. (1988a)
phyll
Pavona praetoria
4.2 0.6 Wethey and Porter (1976)
Pocillopora damicornis 3.2 2.9 Muscatine et al. (1981)
Octocorals
Antillogorgia turgida
0.6
Burkholder and Burkholder
(1960)
Plexaura flexuosa
0.3
Burkholder and Burkholder
(1960)
Rhigidogorgia flabellum 0.4
Burkholdcr and Burkholder
~g C h- 1 10- 6
Scleractinians
Stylophora pistillata
3.4
(1960)
1.1 Titlyanov et al. (1988a)
cells of
Acropora prostrata
3.2
1.2 Titlyanov et al. (1988a)
zooxanthellae
Merulina laxa
5.1
1.3 Titlyanov et al. (1988a)
Porites nigrescens
2.6 0.9 Titlyanov ct al. (1988a)
Octocorals
Sinularia sp.
5.2
1.7 Data by the author
Alcyonium molle
5.8 2.6 Data by the author
Sarcophyton glaucum
3.13 1.1 Data by the author
(heterotrophic) nutrition even at the formally correctly measured
compensation point.
In accordance with the above considerations about the importance of
presentation of the Pt and Mt data on a 24-h basis, during our generalization
of available data given per hour, we recalculated them as per 24-h,
employing the ratio of these values (coefficients Kp; Table 8.5), which we
have obtained in experiments. The results of such a generalization are given
in Tables 9.1-9.3. The Pt and Mt data are represented in them per 1cm 2 of
colony surface (Table 9.1), per g of colony dry weight (Tables 9.2,9.4), per
10 6 cells of zooxanthellae, and per mg of chlorophyll (Table 9.3). The
corresponding data on the photosynthesis and respiration of octocorals and
of the zoantharians are given in Tables 9.5, 9.6. Tables 9.4-9.6 show the
ratios of photosynthesis to respiration and to the biomasses of polyps and of
zooxanthellae (P/Mt, PtlBp, Pt/Bz ), as well as the ratio of respiration to the
biomass of polyps (Mt/B p ). The analysis of available data, given in the
tables, shows that within the light intensities 100-10% PARS the rates of
gross photosynthesis in most of scleractinian corals ranges within 30 to
10011g02g-lh-l, rarely attaining 140-16011g02h-1 (Propp 1985). The
latter values were measured in the corals Montipora tuberculosa and
Merulina laxa in flow respirometers. The values below 20 llg O2 g -I h -1 were
recorded only in some massive corals, in which the ratio of biomass to
skeletal mass was lower than in ramose or foliose species. Among such
massive corals with a low photosynthesis per g of colony weight were
Cyphastrea, Goniastrea, massive Porites species, and Favites. In our
experiments carried out under stable conditions, the range of values
obtained for various taxa of corals were much narrower than could be found
in the literature (cf. Tables 9.2, 9.4). In the first case, the rates of