

Autotrophic Feeding of Corals
327
reliability of both methods, it was stated that the latter gives values up to
1.5-2 times less than the former (Dennison and Barnes 1988; Tchabardgy
and Fam Van Huen 1988), while there was also evideuce of a reliable
comparability of both methods (Mergner and Svoboda 1977). In fact, the
experiments in closed containers, being short-term (1-2 h), could not be
expected to produce some artifacts, moreover, data on rates of
photosynthesis obtained by different authors for the same coral species
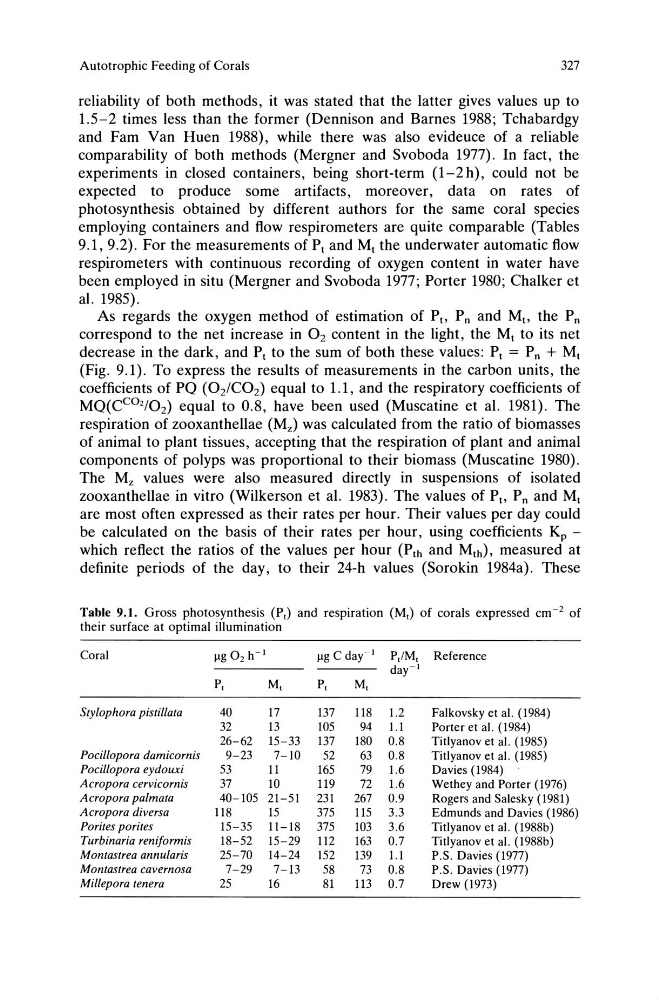
employing containers and flow respirometers are quite comparable (Tables
9.1, 9.2). For the measurements of P t and M t the underwater automatic flow
respirometers with continuous recording of oxygen content in water have
been employed in situ (Mergner and Svoboda 1977; Porter 1980; Chalker et
al. 1985).
As regards the oxygen method of estimation of Pt, P nand Mt, the P n
correspond to the net increase in O2 content in the light, the Mt to its net
decrease in the dark, and P t to the sum of both these values: Pt = P n + Mt
(Fig. 9.1). To express the results of measurements in the carbon units, the
coefficients of PO (02/C02) equal to 1.1, and the respiratory coefficients of
MO(CCO'/02) equal to 0.8, have been used (Muscatine et al. 1981). The
respiration of zooxanthellae (Mz) was calculated from the ratio of biomasses
of animal to plant tissues, accepting that the respiration of plant and animal
components of polyps was proportional to their biomass (Muscatine 1980).
The Mz values were also measured directly in suspensions of isolated
zooxanthellae in vitro (Wilkerson et al. 1983). The values of Pt, Pn and Mt
are most often expressed as their rates per hour. Their values per day could
be calculated on the basis of their rates per hour, using coefficients Kp -
which reflect the ratios of the values per hour (Pth and Mth), measured at
definite periods of the day, to their 24-h values (Sorokin 1984a). These
Table 9.1. Gross photosynthesis (P,) and respiration (M,) of corals expressed cm- 2 of
their surface at optimal illumination
Coral
Ilg 0, h- 1
Ilg C day-l P,/M, Reference
day-l
P,
M,
P,
M,
Stylophora pistillata
40
17
137
118 1.2
Falkovsky et al. (1984)
32
13
105
94 1.1
Porter et al. (1984)
26-62 15-33 137
180 0.8
Titlyanov et al. (1985)
Pocillopora damicornis
9-23
7-10
52
63 0.8
Titlyanov et al. (1985)
Pocillopora eydouxi
53
11
165
79 l.6
Davies (1984)
Acropora cervicornis
37
10
119
72 1.6
Wethey and Porter (1976)
Acropora palmata
40-105 21-51 231
267 0.9
Rogers and Salesky (1981)
Acropora diversa
118
15
375
115 3.3
Edmunds and Davies (1986)
Porites porites
15-35 11-18 375
103 3.6
Titlyanov et al. (1988b)
Turbinaria reniformis
18-52 15-29 112
163 0.7
Titlyanov et al. (1988b)
Montastrea annularis
25-70 14-24 152
139 1.1
P.S. Davies (1977)
Montastrea cavernosa
7-29
7-13
58
73 0.8
P.S. Davies (1977)
Millepora tenera
25
16
81
113 0.7
Drew (1973)
327
reliability of both methods, it was stated that the latter gives values up to
1.5-2 times less than the former (Dennison and Barnes 1988; Tchabardgy
and Fam Van Huen 1988), while there was also evideuce of a reliable
comparability of both methods (Mergner and Svoboda 1977). In fact, the
experiments in closed containers, being short-term (1-2 h), could not be
expected to produce some artifacts, moreover, data on rates of
photosynthesis obtained by different authors for the same coral species
employing containers and flow respirometers are quite comparable (Tables
9.1, 9.2). For the measurements of P t and M t the underwater automatic flow
respirometers with continuous recording of oxygen content in water have
been employed in situ (Mergner and Svoboda 1977; Porter 1980; Chalker et
al. 1985).
As regards the oxygen method of estimation of Pt, P nand Mt, the P n
correspond to the net increase in O2 content in the light, the Mt to its net
decrease in the dark, and P t to the sum of both these values: Pt = P n + Mt
(Fig. 9.1). To express the results of measurements in the carbon units, the
coefficients of PO (02/C02) equal to 1.1, and the respiratory coefficients of
MO(CCO'/02) equal to 0.8, have been used (Muscatine et al. 1981). The
respiration of zooxanthellae (Mz) was calculated from the ratio of biomasses
of animal to plant tissues, accepting that the respiration of plant and animal
components of polyps was proportional to their biomass (Muscatine 1980).
The Mz values were also measured directly in suspensions of isolated
zooxanthellae in vitro (Wilkerson et al. 1983). The values of Pt, Pn and Mt
are most often expressed as their rates per hour. Their values per day could
be calculated on the basis of their rates per hour, using coefficients Kp -
which reflect the ratios of the values per hour (Pth and Mth), measured at
definite periods of the day, to their 24-h values (Sorokin 1984a). These
Table 9.1. Gross photosynthesis (P,) and respiration (M,) of corals expressed cm- 2 of
their surface at optimal illumination
Coral
Ilg 0, h- 1
Ilg C day-l P,/M, Reference
day-l
P,
M,
P,
M,
Stylophora pistillata
40
17
137
118 1.2
Falkovsky et al. (1984)
32
13
105
94 1.1
Porter et al. (1984)
26-62 15-33 137
180 0.8
Titlyanov et al. (1985)
Pocillopora damicornis
9-23
7-10
52
63 0.8
Titlyanov et al. (1985)
Pocillopora eydouxi
53
11
165
79 l.6
Davies (1984)
Acropora cervicornis
37
10
119
72 1.6
Wethey and Porter (1976)
Acropora palmata
40-105 21-51 231
267 0.9
Rogers and Salesky (1981)
Acropora diversa
118
15
375
115 3.3
Edmunds and Davies (1986)
Porites porites
15-35 11-18 375
103 3.6
Titlyanov et al. (1988b)
Turbinaria reniformis
18-52 15-29 112
163 0.7
Titlyanov et al. (1988b)
Montastrea annularis
25-70 14-24 152
139 1.1
P.S. Davies (1977)
Montastrea cavernosa
7-29
7-13
58
73 0.8
P.S. Davies (1977)
Millepora tenera
25
16
81
113 0.7
Drew (1973)