

Sponges
177
estimated to be around 12% of their net photosynthetic production, the rest
corresponding to the necrotrophic way. The "infestation" of sponges with
the blue-green synbionts proceeds most probably via the eggs, since they
have been found also in the larvae of some sponges.
The algal symbionts are useful for sponges not only as their feeders. As
many other blue-green algae, they also fix atmospheric nitrogen, thus
improving the nitrogen balance of the host (Wilkinson and Fay 1979). The
algae consume also the inorganic nutrients from water driven through the
channels. They use the end-products of the host's metabolism. These
products (mostly-nurients) are assimilated into the biomass of algae and
used by the host after their digestion. So the presence of algae in a symbiotic
sponge provides a semiclosed recycling of nutrients in their hosts, which is
extremely important for life in nutrient-poor reef waters. Indeed, sponges
which harbor the algal symbionts grow much faster in biotopes in the light
than in those in the shade (Wilkinson and Vacelet 1979). The blue-greens
are harbored as symbionts by the sponges from a different their taxa.
Within the sponges communities of reefs three main trophic growths
could be identified: phototrophic sponges, mixotrophic sponges and
heterotrophic sponges. They are characterized by the degree of participation
in photosynthesis production in compensation for their respiratory losses.
The latter is expressed by the ratios of photosynthesis to respiration (PtlMt)
as measured at an average illumination typical at depths of 10-30 m, where
usually most of the sponge species live (400IlEm-2s-1). In the phototrophic sponges this ratio is 1.5, in mixotrophic > 1.5, and in heterotrophic
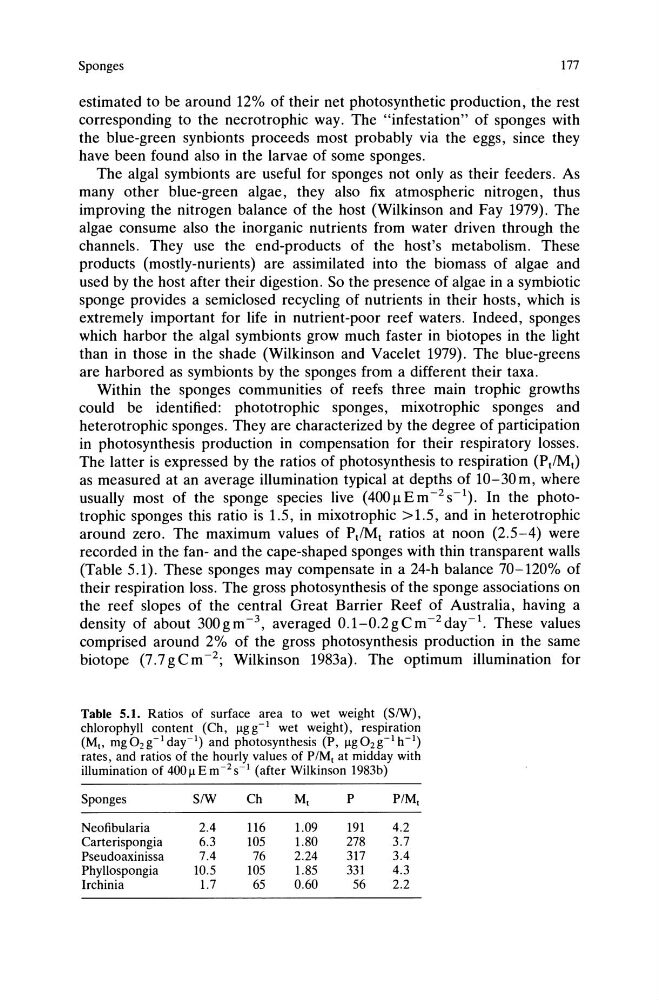
around zero. The maximum values of PtlMt ratios at noon (2.5-4) were
recorded in the fan- and the cape-shaped sponges with thin transparent walls
(Table 5.1). These sponges may compensate in a 24-h balance 70-120% of
their respiration loss. The gross photosynthesis of the sponge associations on
the reef slopes of the central Great Barrier Reef of Australia, having a
density of about 300gm- 3 , averaged 0.1-0.2gCm- 2 day-1. These values
comprised around 2% of the gross photosynthesis production in the same
biotope (7.7gCm- 2 ; Wilkinson 1983a). The optimum illumination for
Table 5.1. Ratios of surface area to wet weight (SIW),
chlorophyll content (Ch, ~gg-l wet weight), respiration
(M" mg02g-lday-l) and photosynthesis (P, ~g02g-1h-l)
rates, and ratios of the hourly values of P/M, at midday with
illumination of 400~Em-2s-1 (after Wilkinson 1983b)
Sponges
S/W
Ch
M,
P
P/M,
Neofibularia
2.4
116
1.09
191
4.2
Carterispongia
6.3
105
1.80
278
3.7
Pseudoaxinissa
7.4
76
2.24
317
3.4
Phyllospongia
10.5
105
1.85
331
4.3
Irchinia
1.7
65
0.60
56
2.2
177
estimated to be around 12% of their net photosynthetic production, the rest
corresponding to the necrotrophic way. The "infestation" of sponges with
the blue-green synbionts proceeds most probably via the eggs, since they
have been found also in the larvae of some sponges.
The algal symbionts are useful for sponges not only as their feeders. As
many other blue-green algae, they also fix atmospheric nitrogen, thus
improving the nitrogen balance of the host (Wilkinson and Fay 1979). The
algae consume also the inorganic nutrients from water driven through the
channels. They use the end-products of the host's metabolism. These
products (mostly-nurients) are assimilated into the biomass of algae and
used by the host after their digestion. So the presence of algae in a symbiotic
sponge provides a semiclosed recycling of nutrients in their hosts, which is
extremely important for life in nutrient-poor reef waters. Indeed, sponges
which harbor the algal symbionts grow much faster in biotopes in the light
than in those in the shade (Wilkinson and Vacelet 1979). The blue-greens
are harbored as symbionts by the sponges from a different their taxa.
Within the sponges communities of reefs three main trophic growths
could be identified: phototrophic sponges, mixotrophic sponges and
heterotrophic sponges. They are characterized by the degree of participation
in photosynthesis production in compensation for their respiratory losses.
The latter is expressed by the ratios of photosynthesis to respiration (PtlMt)
as measured at an average illumination typical at depths of 10-30 m, where
usually most of the sponge species live (400IlEm-2s-1). In the phototrophic sponges this ratio is 1.5, in mixotrophic > 1.5, and in heterotrophic
around zero. The maximum values of PtlMt ratios at noon (2.5-4) were
recorded in the fan- and the cape-shaped sponges with thin transparent walls
(Table 5.1). These sponges may compensate in a 24-h balance 70-120% of
their respiration loss. The gross photosynthesis of the sponge associations on
the reef slopes of the central Great Barrier Reef of Australia, having a
density of about 300gm- 3 , averaged 0.1-0.2gCm- 2 day-1. These values
comprised around 2% of the gross photosynthesis production in the same
biotope (7.7gCm- 2 ; Wilkinson 1983a). The optimum illumination for
Table 5.1. Ratios of surface area to wet weight (SIW),
chlorophyll content (Ch, ~gg-l wet weight), respiration
(M" mg02g-lday-l) and photosynthesis (P, ~g02g-1h-l)
rates, and ratios of the hourly values of P/M, at midday with
illumination of 400~Em-2s-1 (after Wilkinson 1983b)
Sponges
S/W
Ch
M,
P
P/M,
Neofibularia
2.4
116
1.09
191
4.2
Carterispongia
6.3
105
1.80
278
3.7
Pseudoaxinissa
7.4
76
2.24
317
3.4
Phyllospongia
10.5
105
1.85
331
4.3
Irchinia
1.7
65
0.60
56
2.2