

140
Benthic Microflora, Periphyton and Plant Associations
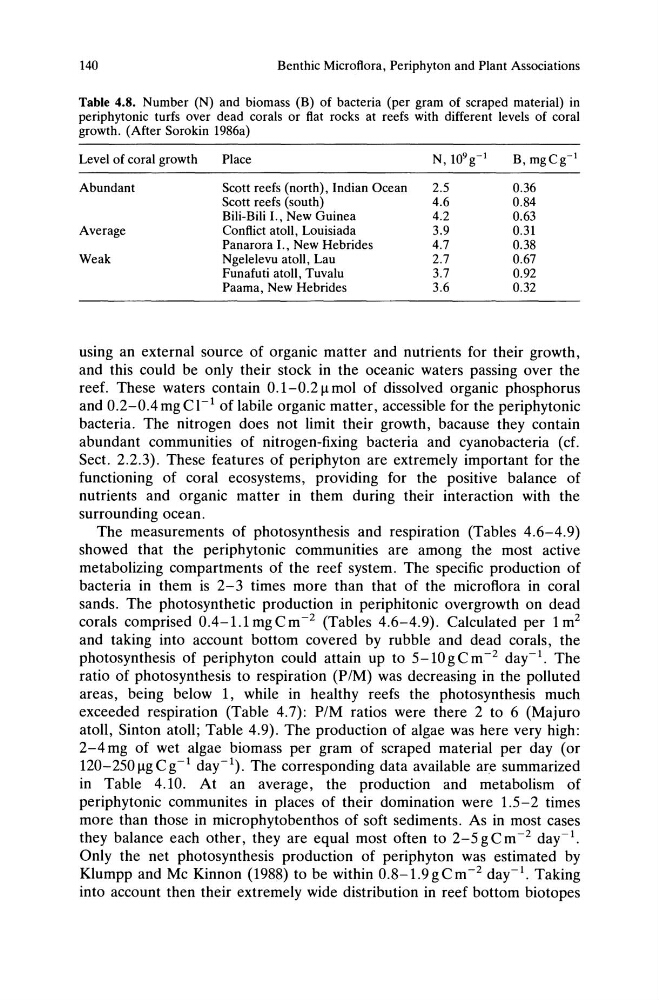
Table 4.8. Number (N) and biomass (B) of bacteria (per gram of scraped material) in
periphytonic turfs over dead corals or flat rocks at reefs with different levels of coral
growth. (After Sorokin 1986a)
Level of coral growth
Place
N,109 g-1
B, mgCg- 1
Abundant
Scott reefs (north), Indian Ocean
2.5
0.36
Scott reefs (south)
4.6
0.84
Bili-Bili I., New Guinea
4.2
0.63
Average
Conflict atoll, Louisiada
3.9
0.31
Panarora I., New Hebrides
4.7
0.38
Weak
Ngelelevu atoll, Lau
2.7
0.67
Funafuti atoll, Tuvalu
3.7
0.92
Paama, New Hebrides
3.6
0.32
using an external source of organic matter and nutrients for their growth,
and this could be only their stock in the oceanic waters passing over the
reef. These waters contain 0.1-0.211 mol of dissolved organic phosphorus
and 0.2-0.4mgCI- 1 of labile organic matter, accessible for the periphytonic
bacteria. The nitrogen does not limit their growth, bacause they contain
abundant communities of nitrogen-fixing bacteria and cyanobacteria (ct.
Sect. 2.2.3). These features of periphyton are extremely important for the
functioning of coral ecosystems, providing for the positive balance of
nutrients and organic matter in them during their interaction with the
surrounding ocean.
The measurements of photosynthesis and respiration (Tables 4.6-4.9)
showed that the periphytonic communities are among the most active
metabolizing compartments of the reef system. The specific production of
bacteria in them is 2-3 times more than that of the microflora in coral
sands. The photosynthetic production in periphitonic overgrowth on dead
corals comprised 0.4-1.1mgCm- 2 (Tables 4.6-4.9). Calculated per 1m2
and taking into account bottom covered by rubble and dead corals, the
photosynthesis of periphyton could attain up to 5-10 g C m -2 day-I. The
ratio of photosynthesis to respiration (P/M) was decreasing in the polluted
areas, being below 1, while in healthy reefs the photosynthesis much
exceeded respiration (Table 4.7): P/M ratios were there 2 to 6 (Majuro
atoll, Sinton atoll; Table 4.9). The production of algae was here very high:
2-4 mg of wet algae biomass per gram of scraped material per day (or
120-250I1gCg-I day-I). The corresponding data available are summarized
in Table 4.10. At an average, the production and metabolism of
periphytonic communites in places of their domination were 1.5-2 times
more than those in microphytobenthos of soft sediments. As in most cases
they balance each other, they are equal most often to 2-5gCm- 2 day-I.
Only the net photosynthesis production of periphyton was estimated by
Klumpp and Mc Kinnon (1988) to be within 0.8-1.9gCm- 2 day-I. Taking
into account then their extremely wide distribution in reef bottom biotopes
Benthic Microflora, Periphyton and Plant Associations
Table 4.8. Number (N) and biomass (B) of bacteria (per gram of scraped material) in
periphytonic turfs over dead corals or flat rocks at reefs with different levels of coral
growth. (After Sorokin 1986a)
Level of coral growth
Place
N,109 g-1
B, mgCg- 1
Abundant
Scott reefs (north), Indian Ocean
2.5
0.36
Scott reefs (south)
4.6
0.84
Bili-Bili I., New Guinea
4.2
0.63
Average
Conflict atoll, Louisiada
3.9
0.31
Panarora I., New Hebrides
4.7
0.38
Weak
Ngelelevu atoll, Lau
2.7
0.67
Funafuti atoll, Tuvalu
3.7
0.92
Paama, New Hebrides
3.6
0.32
using an external source of organic matter and nutrients for their growth,
and this could be only their stock in the oceanic waters passing over the
reef. These waters contain 0.1-0.211 mol of dissolved organic phosphorus
and 0.2-0.4mgCI- 1 of labile organic matter, accessible for the periphytonic
bacteria. The nitrogen does not limit their growth, bacause they contain
abundant communities of nitrogen-fixing bacteria and cyanobacteria (ct.
Sect. 2.2.3). These features of periphyton are extremely important for the
functioning of coral ecosystems, providing for the positive balance of
nutrients and organic matter in them during their interaction with the
surrounding ocean.
The measurements of photosynthesis and respiration (Tables 4.6-4.9)
showed that the periphytonic communities are among the most active
metabolizing compartments of the reef system. The specific production of
bacteria in them is 2-3 times more than that of the microflora in coral
sands. The photosynthetic production in periphitonic overgrowth on dead
corals comprised 0.4-1.1mgCm- 2 (Tables 4.6-4.9). Calculated per 1m2
and taking into account bottom covered by rubble and dead corals, the
photosynthesis of periphyton could attain up to 5-10 g C m -2 day-I. The
ratio of photosynthesis to respiration (P/M) was decreasing in the polluted
areas, being below 1, while in healthy reefs the photosynthesis much
exceeded respiration (Table 4.7): P/M ratios were there 2 to 6 (Majuro
atoll, Sinton atoll; Table 4.9). The production of algae was here very high:
2-4 mg of wet algae biomass per gram of scraped material per day (or
120-250I1gCg-I day-I). The corresponding data available are summarized
in Table 4.10. At an average, the production and metabolism of
periphytonic communites in places of their domination were 1.5-2 times
more than those in microphytobenthos of soft sediments. As in most cases
they balance each other, they are equal most often to 2-5gCm- 2 day-I.
Only the net photosynthesis production of periphyton was estimated by
Klumpp and Mc Kinnon (1988) to be within 0.8-1.9gCm- 2 day-I. Taking
into account then their extremely wide distribution in reef bottom biotopes